Thermal Conductivity Coefficient Measurement
In this article, we're diving into how you can measure the thermal conductivity coefficient, basically, a material's ability to transfer heat without breaking the bank or getting bogged down in complexity. This article kicks off a series dedicated to assessing raw material performance in the Additively Manufactured Electronics (AME) sector. While we're not aiming for the precision obtained by certified labs or the most sophisticated measurement methods, we are focusing on cheap and straightforward techniques that any technical team can use to investigate the relevance of different materials in applications. The material portfolio in the AME industry is growing fast and new materials with new manufacturing processes rapidly appear in the market. This led us to develop methods that will help you quickly figure out if a particular material or process is a good fit for your application. So, if you're experimenting with materials in AME and looking for practical, easy-to-apply test methods, this article-series will get you covered.
Due to the ongoing process of improving these setups and increasing the availability of AME technology to the industry, we appreciate any suggestions, criticisms, or comments in the comments section at the end of the article.
Project Description
Designing electronic equipment comes with its set of challenges, such as making devices smaller, boosting their efficiency, ensuring electromagnetic compatibility, and managing heat issues. Heat management stands out as a critical factor because it directly impacts the performance, reliability, and safety of both components and the overall equipment. In this article, we'll explore the fundamentals of thermal resistance and introduce a simple, cost-effective method that can be easily replicated in a basic electrical lab. Our aim is to get the thermal conductivity coefficient with tolerance up to 10% from the actual value within a tiny budget.
Theory Basis
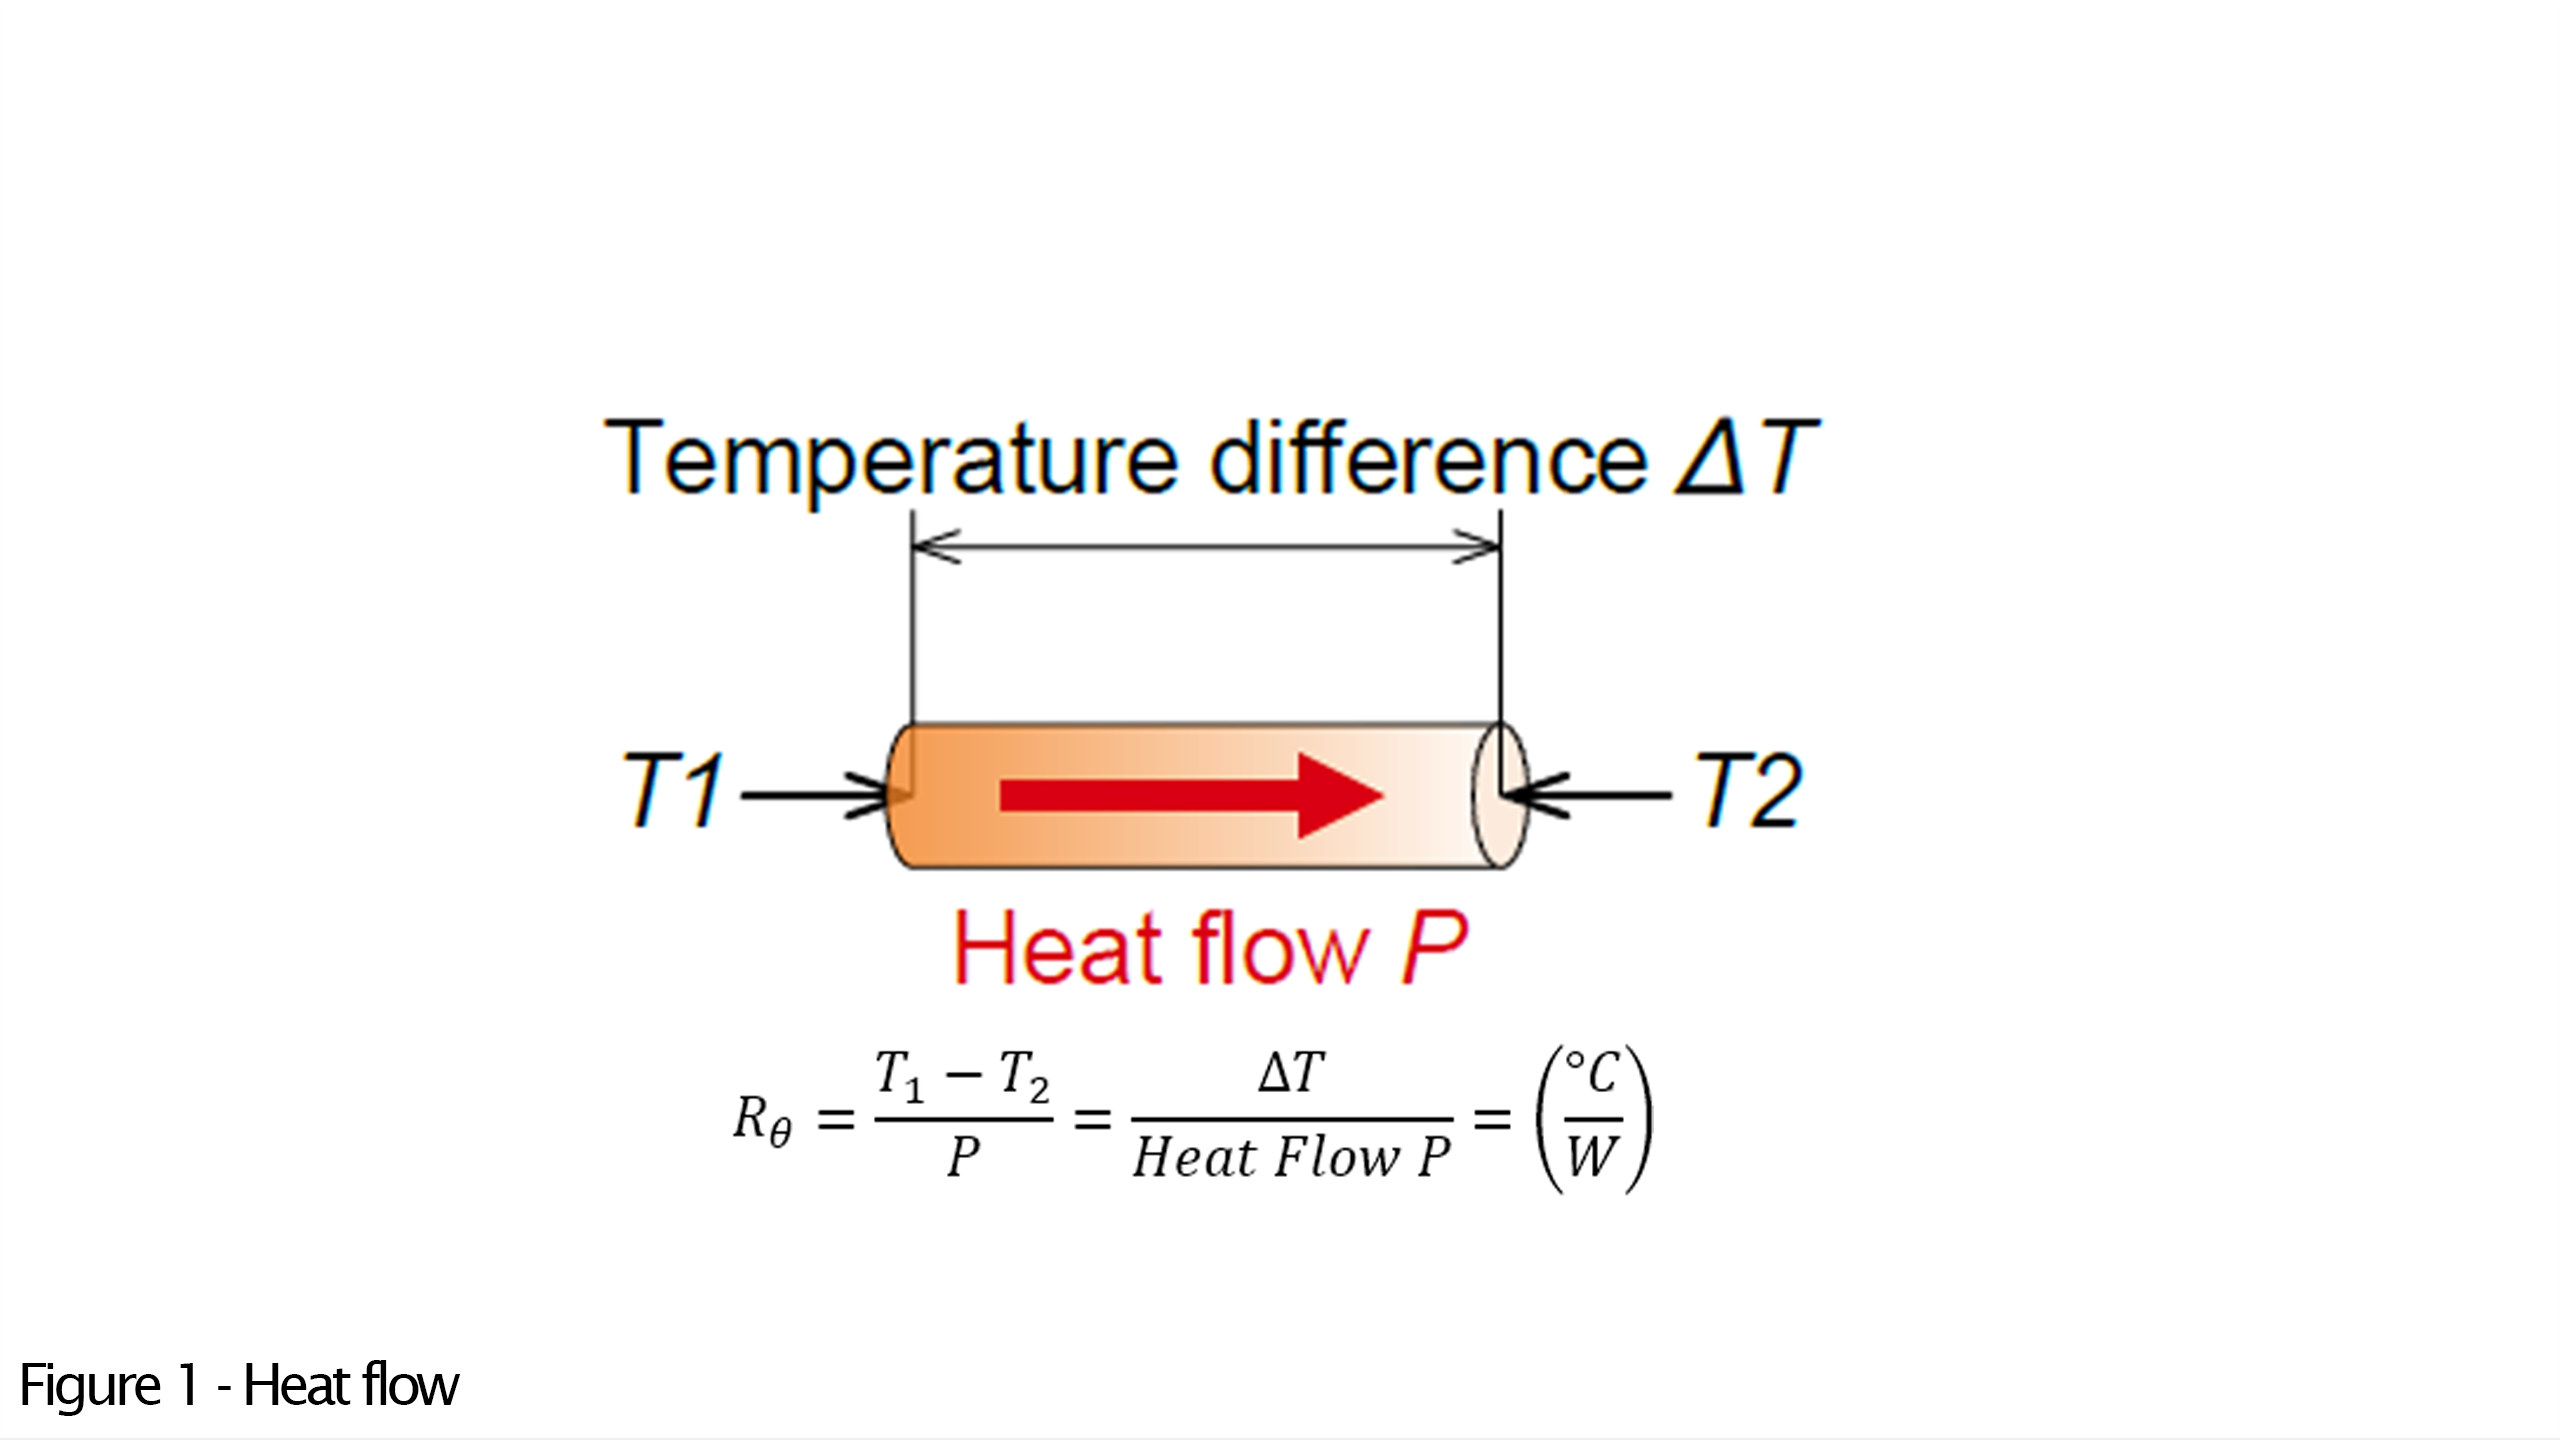
Thermal resistance measures the phenomenon of heat conduction between two points, due to a temperature difference between those two points. It is calculated by dividing the temperature difference between these two points by the heat flow (the amount of heat transferred per unit of time) between them. Therefore, a higher thermal resistance indicates that heat is conducted less easily, while a lower thermal resistance means heat moves more freely.
Heat Conductivity Notation
In electrical contexts, "\( R \nonumber \)" denotes electrical resistance, whereas "\( \theta \nonumber \)" (theta) represents thermal resistance. The Joint Electron Device Engineering Council (JEDEC), a key organization in the microelectronics industry that sets standards, uses "\( \theta \nonumber \)" or "\( R_\theta \nonumber \)" in its guidelines for measuring thermal resistance in integrated circuits, as part of the JESD51 standards. The "XX" in "\( R_{\theta xx} \nonumber \)" or "\( \theta_{xx} \nonumber \)" stands for the symbols identifying the two points being measured. For instance, "\( R_{\theta T_1T_2} \nonumber \)" would be the notation for thermal resistance between points T1 and T2, as illustrated in the referenced Fig 1.
Furthermore, the International Electrotechnical Commission (IEC), which is responsible for establishing and publishing international standards for all electrical, electronic, and related technologies, adopts "Rth" as the notation for thermal resistance in its EN 60747-15 standards concerning discrete semiconductor devices.
Thermal resistance is measured in degrees Kelvin per Watt ( \( \frac{^\circ K}{W} \nonumber \) ) or degrees Celsius per Watt (\( \frac{^\circ C}{W} \nonumber \)). While Kelvin ( \( K \nonumber \) ) and Celsius ( \( C \nonumber \) ) scales differ in their zero points, for the purpose of expressing temperature differences or gradients, the units can be considered interchangeable ( difference equals difference).
Thermal Ohm Law
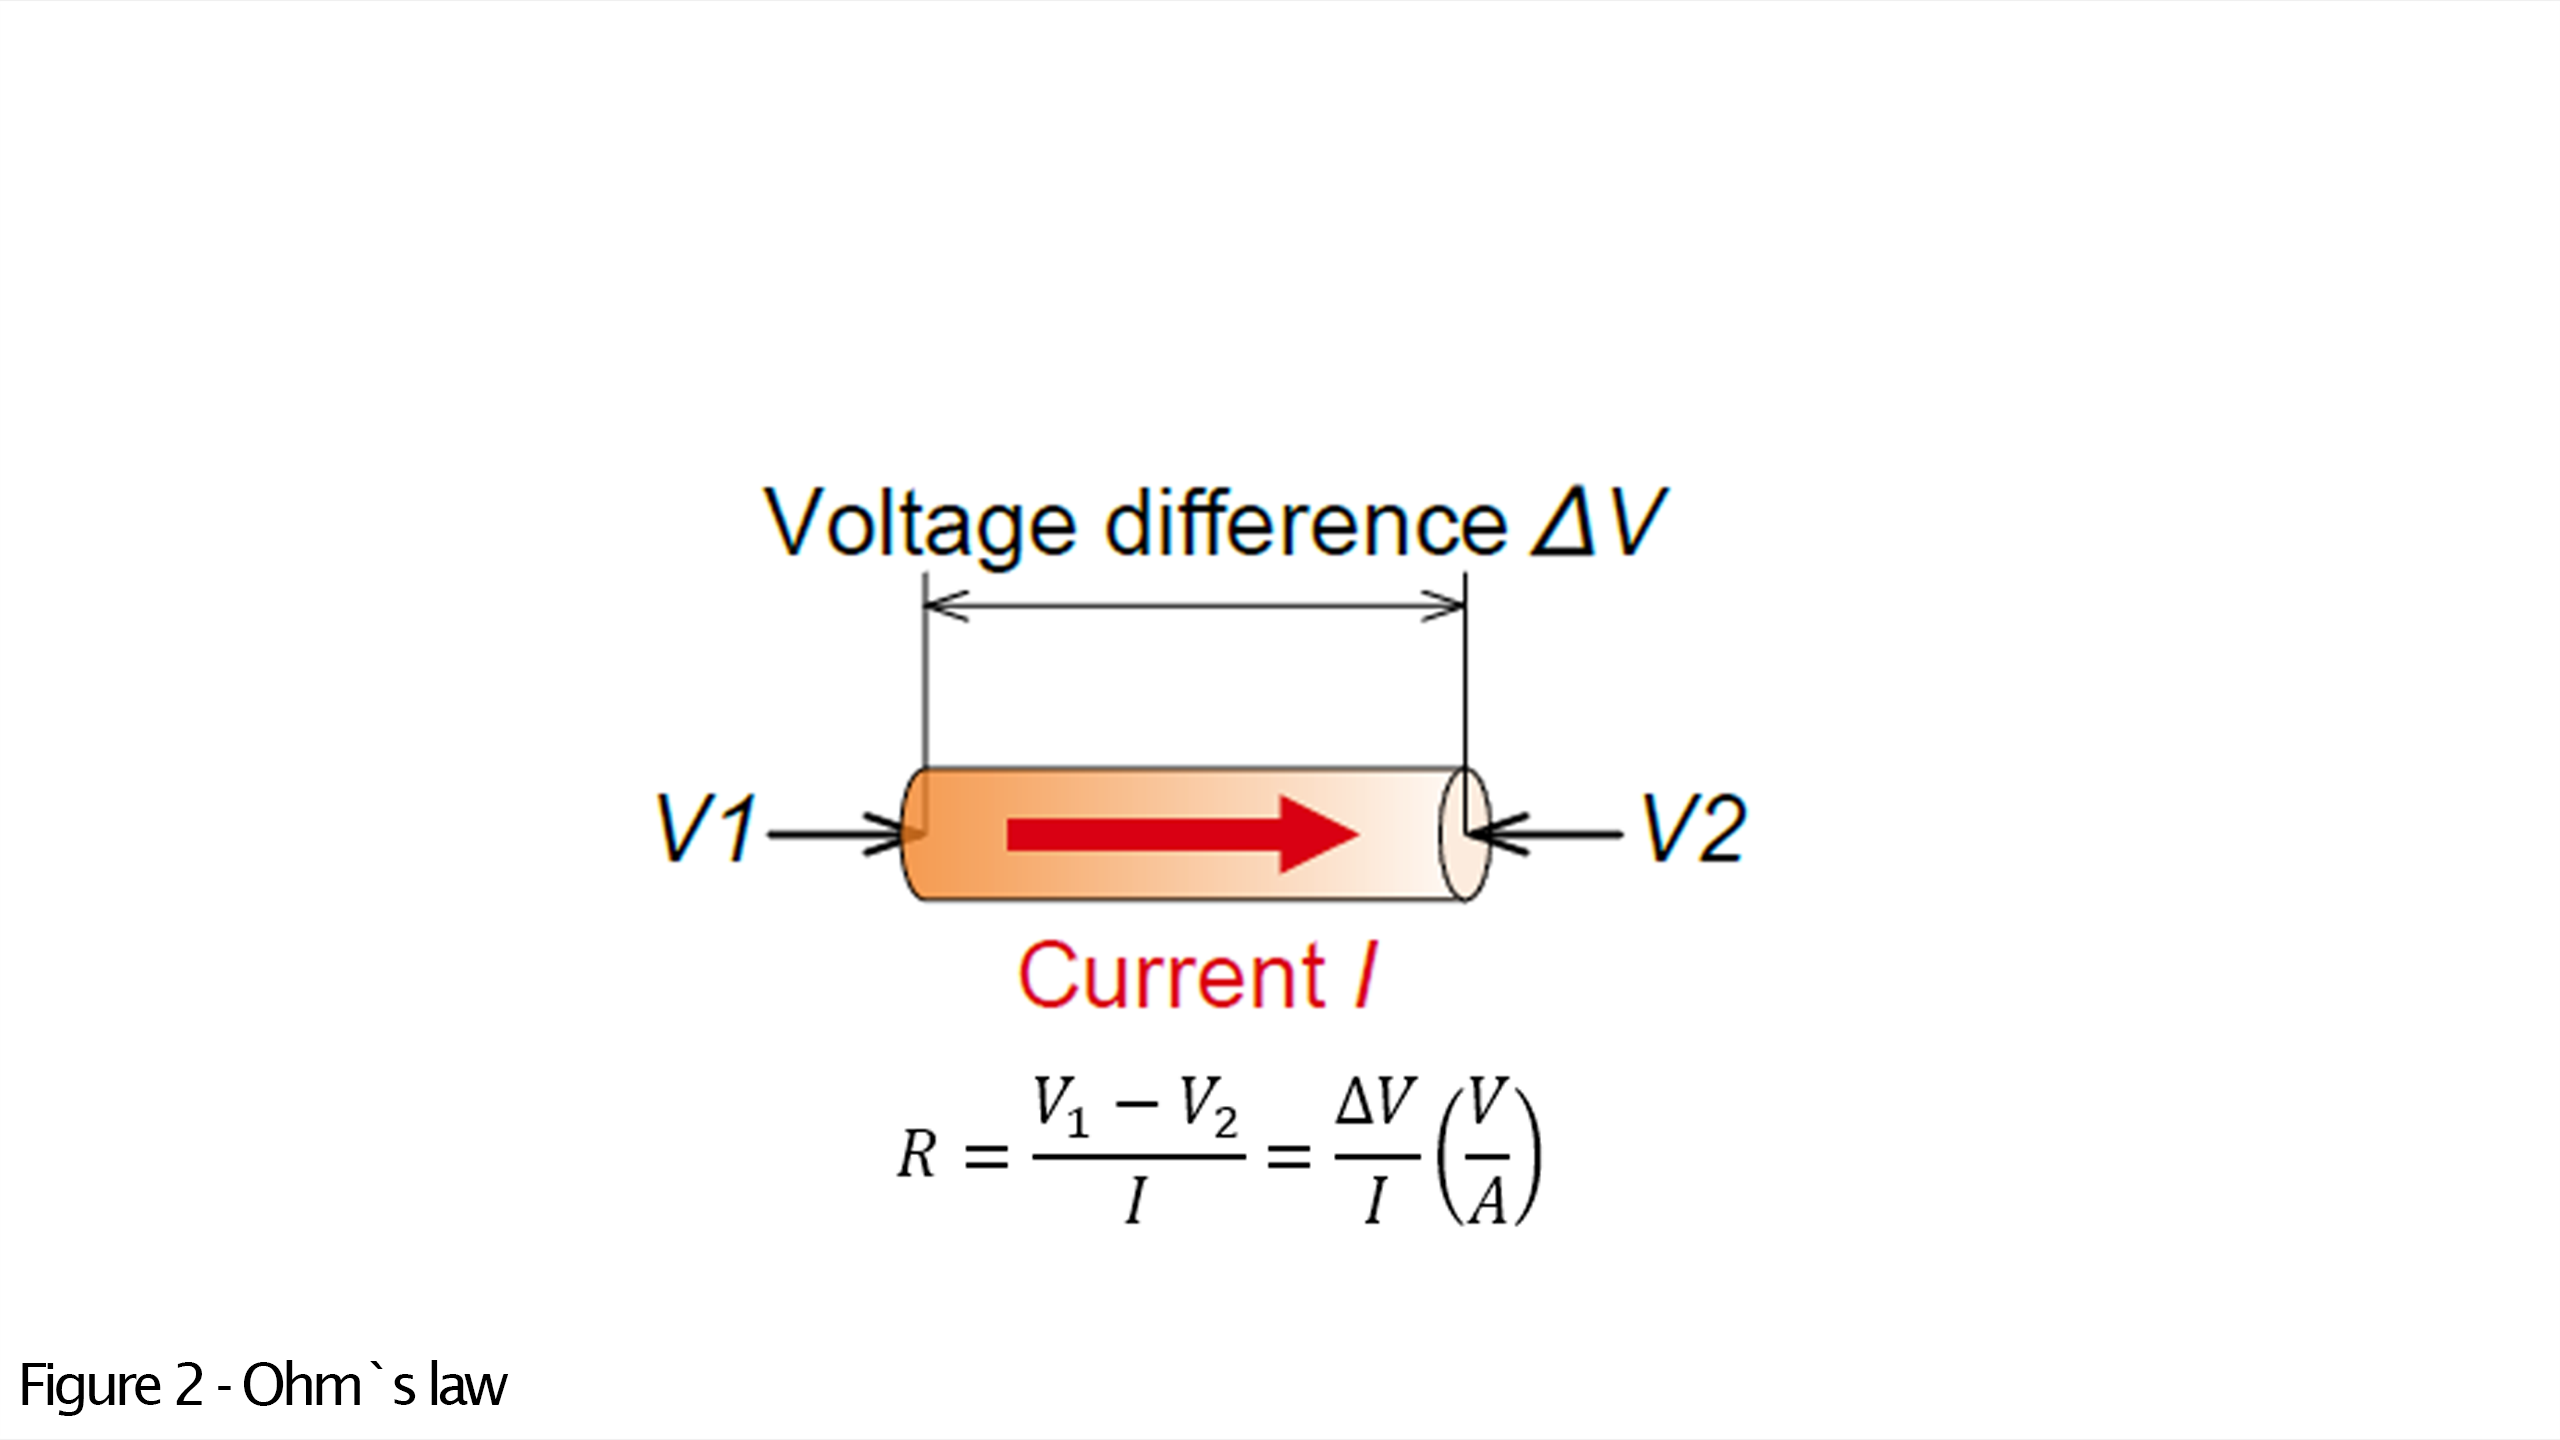
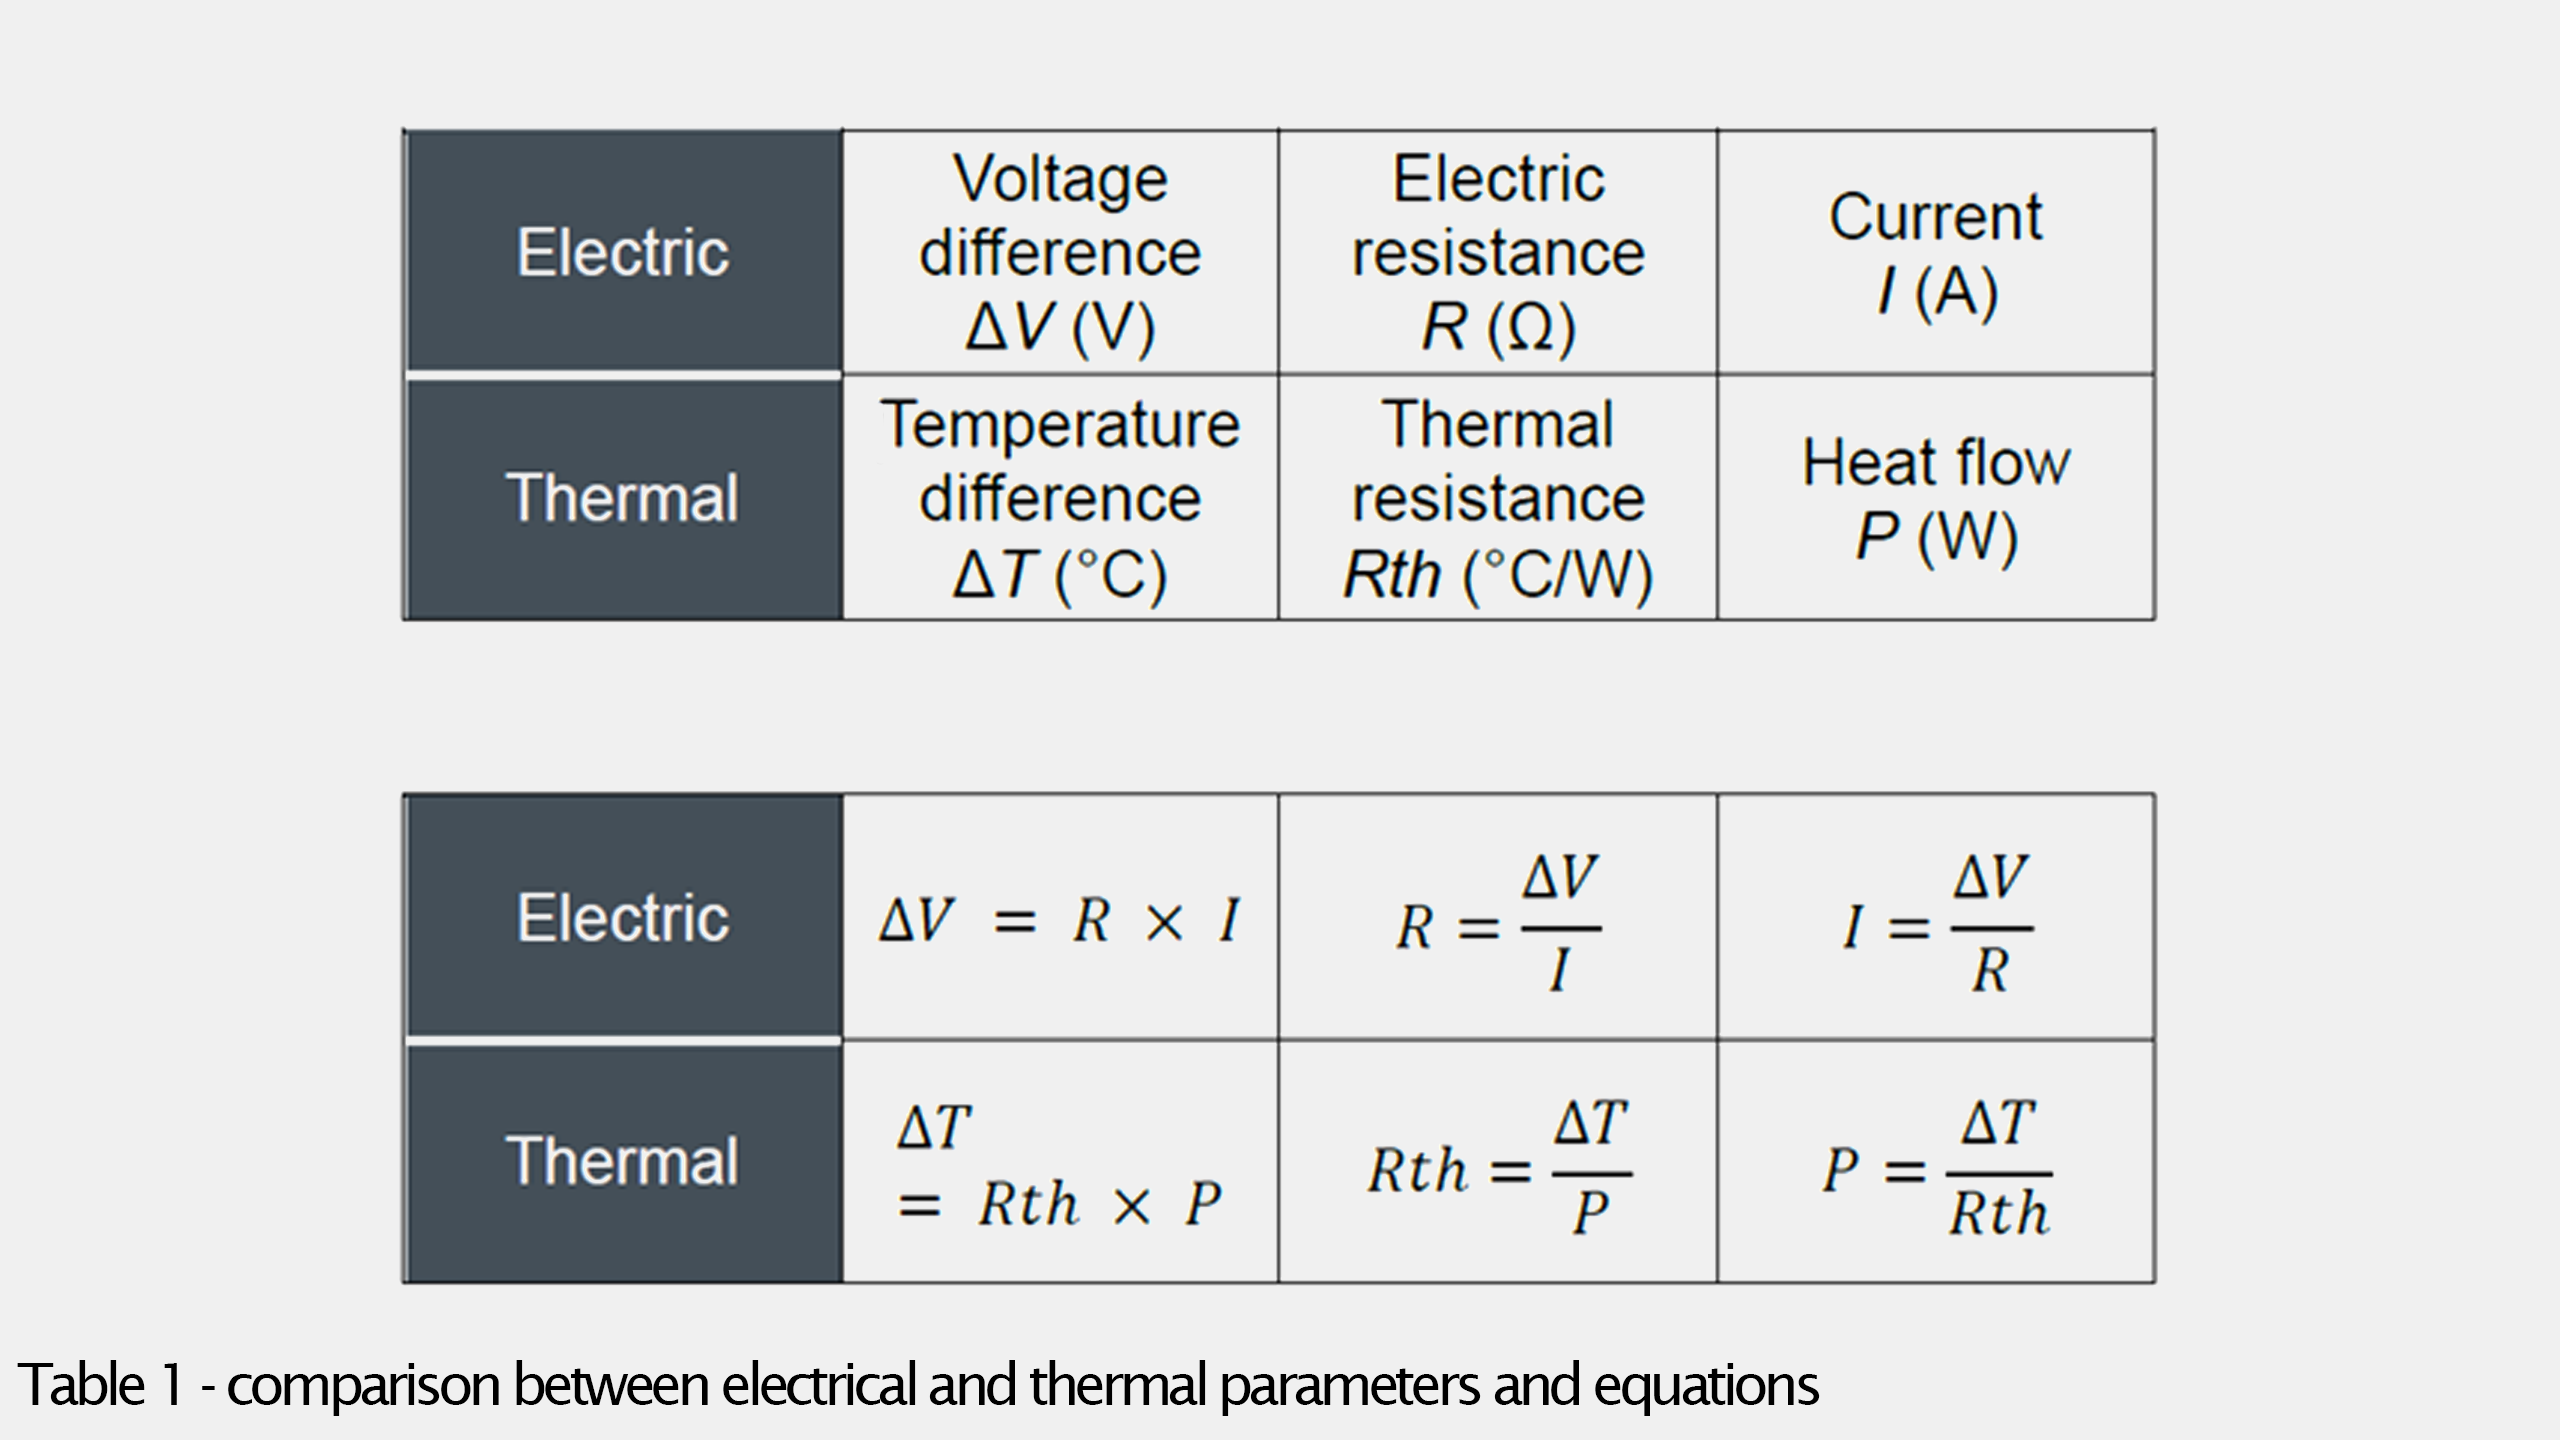
Thermal resistance functions analogously to electrical resistance, and the fundamental equations for thermal calculations mirror those of Ohm's law. In the illustration and equations shown below, it's demonstrated that the parameters for heat can be interchanged with those for electricity. Consequently, just as the voltage difference is determined by multiplied by (current), the temperature difference can be calculated using (thermal resistance) multiplied by (heat flow in watts). These relationships are outlined in the Table 1 below.
Additionally, there is the well-known Wiedemann-Franz Law. This principle posits that the ratio of thermal conductivity (\( k \nonumber \)) to electrical conductivity (\( \sigma \nonumber \)) in a metal is proportional to the temperature (\( T \nonumber \)). The relationship is given by the equation: \( \frac{k}{\sigma}=LT \nonumber \) where \( L \nonumber \) is the Lorenz number, a constant ( \( 2.44\cdot10^{-8}W\Omega K^{-2} \nonumber \) in SI units), and is the absolute temperature in Kelvin.
The Wiedemann-Franz Law highlights the fundamental connection between thermal and electrical transport in metals, showing that metals that are good conductors of electricity are also good conductors of heat. This relationship is due to the fact that in metals, both heat and electrical current are transported by free electrons. The efficiency of these processes is determined by how freely electrons can move through the material, which is a property that influences both electrical and thermal conductivity.
Heat Transfer Paths
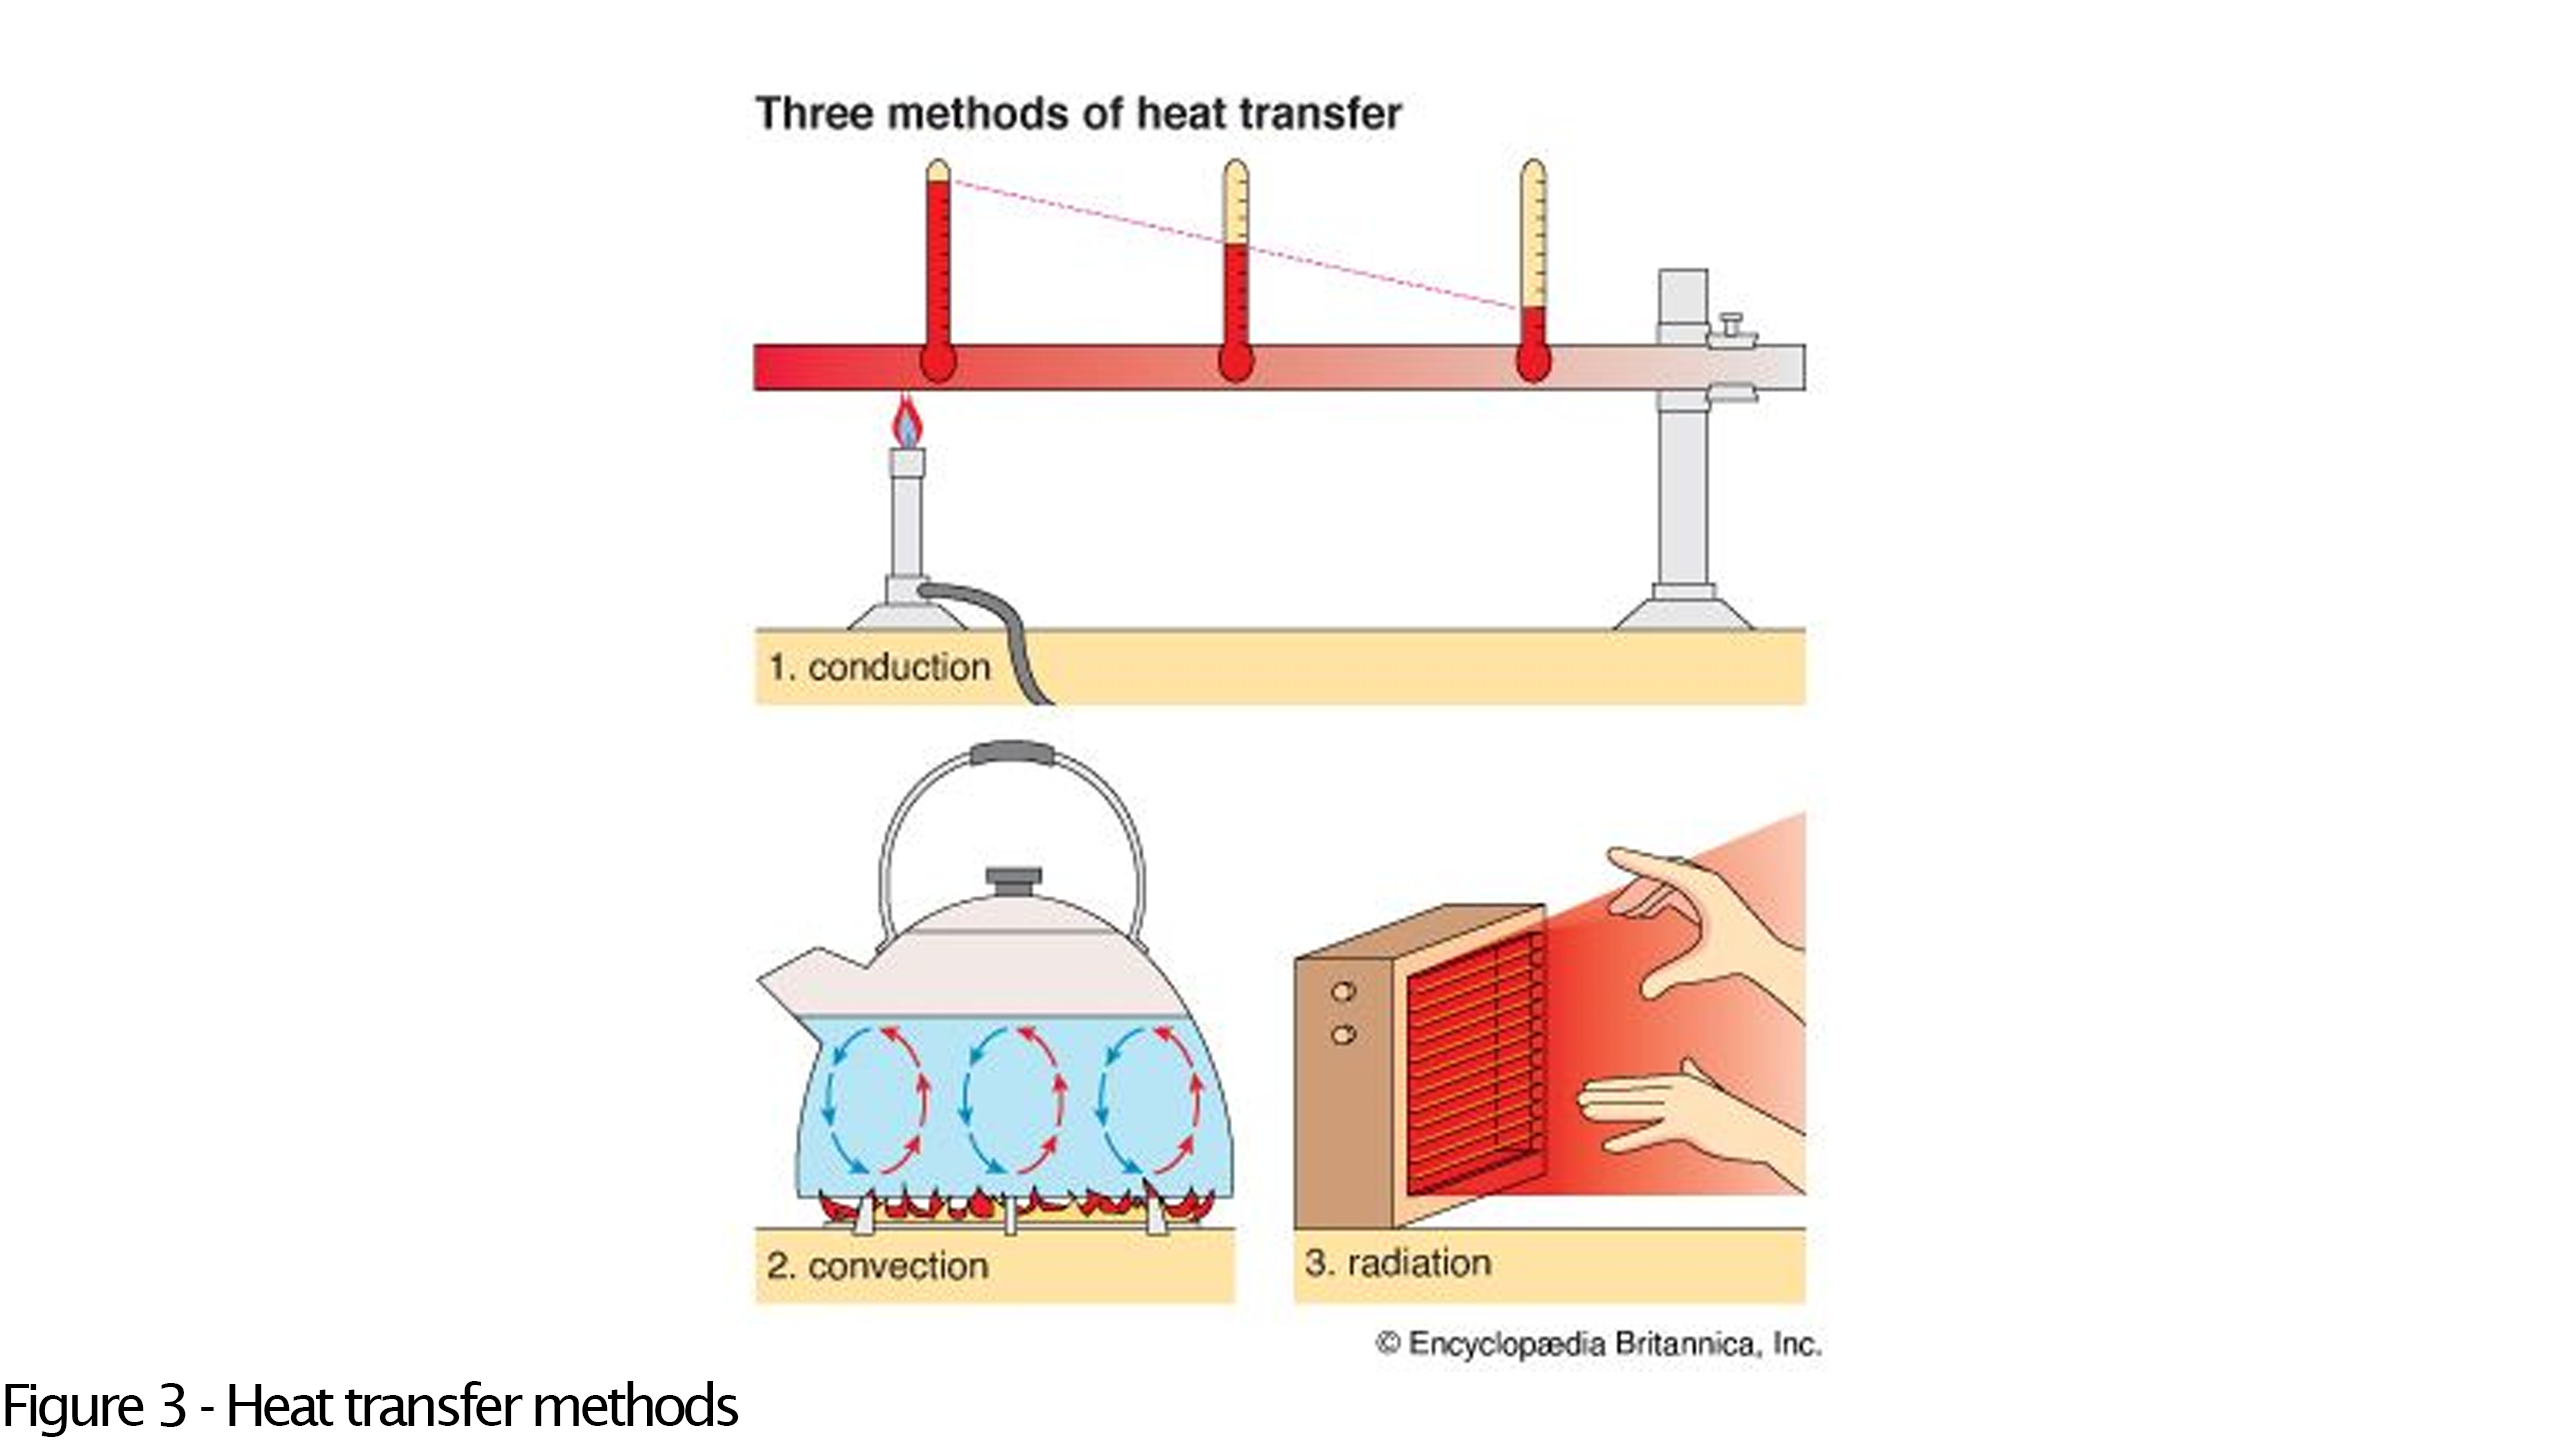
Heat can be transferred through objects and spaces. Transfer of heat means that thermal energy is transferred from one place to another. In the following section, three main heat transfer paths are represented:
- Thermal conduction – this method involves the transfer of heat from a region of higher temperature to a region of lower temperature within the same object. This process occurs due to the motion of the molecules that make up the material, without any actual movement of the material itself.
- Convection – this is a form of heat transfer, occurs when heat is moved by the flow of a fluid (like air or water) that comes into contact with the surface of a solid body, driven by a temperature difference between them. This process can move heat more efficiently than thermal conduction.
- Heat radiation – this method involves the emission of electromagnetic waves from an object's surface, with wavelengths that reflect the surface's temperature. These waves travel through space, reaching and impacting another object. Upon contact, the energy from these waves induces vibrations in the molecules on the receiving object's surface, thereby transferring heat and altering the object's temperature. This type of heat transfer can occur without any intervening medium, meaning it can even happen in a vacuum, and does not affect the temperature of the surrounding air.
for easier understanding the visualization for these pats are shown in Fig 3 below. The first heat transfer method would be the one this article would concentrate on, because there is no liquid in the final printed structures, and the radiation is mostly blocked by solder mask except for the measured pads.
Methodology
In this section the measurement setup and the experiment flow used in the article will be described. Furthermore, a reference measurement with known material parameters will be performed to validate the functionality of the setup.
Main Measurement Setup
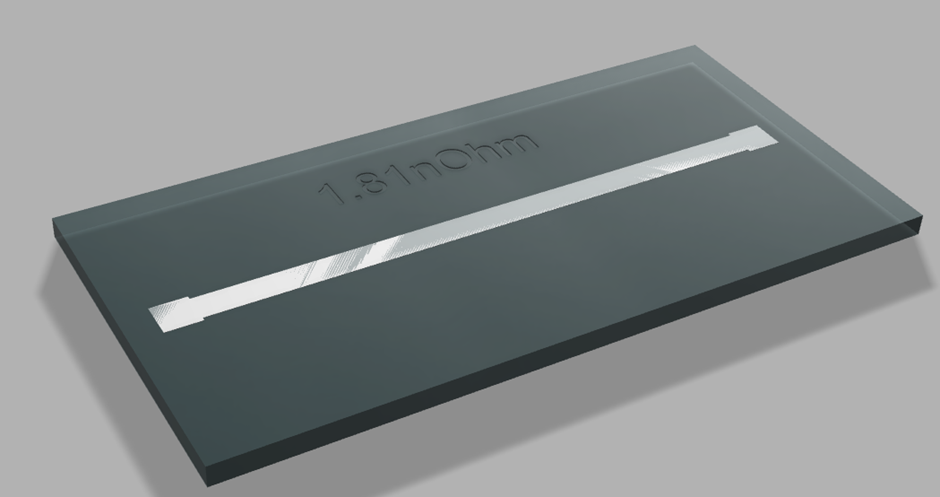
The measurement setup involves using a known trace shape designed and printed using AME. This trace shape provides crucial information such as overall dimensions, trace length (l), and cross-sectional area (A).
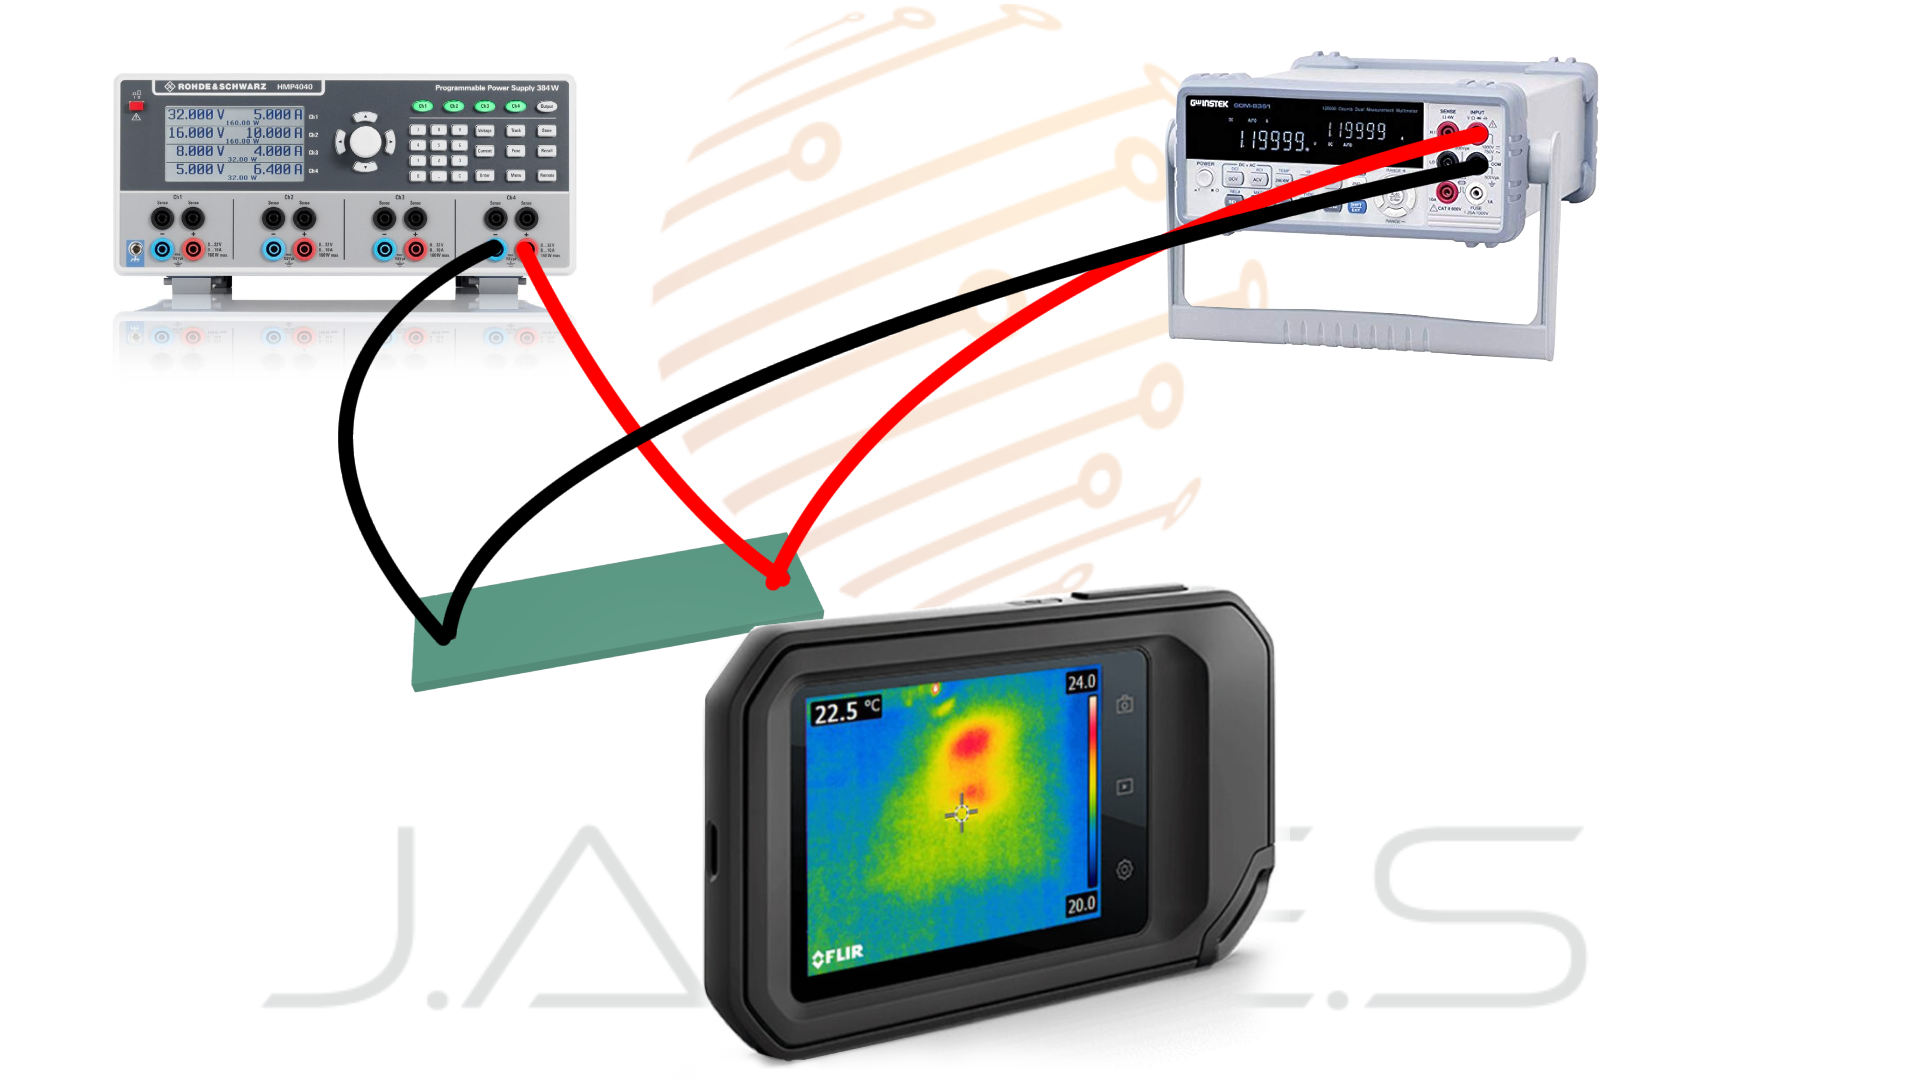
Additionally, the setup includes a power supply and a multimeter to administer controlled heating at a specific point along the trace, while simultaneously measuring the actual power being delivered through the lines.
To monitor thermal changes, an Infrared (IR) camera is used. The camera is focused solely on the sample to accurately document thermal variations. This option was chosen to simplify the setup, alternatively Arduino temperature sensors could be used to increase accuracy . This setup ensures precise control and measurement of heating effects, enabling accurate monitoring of thermal changes during the experiment.
The measurement would be done according to the next formula:
\( Q=-k\frac{A\cdot\Delta T}{l} \)
\( k=\frac{Q\cdot l}{A\cdot(T_1-T_2)} \)
Where \( Q \nonumber \) is the amount of power used for heating, \( A\nonumber \)cross section area and \( l\nonumber \) is length of the conductor, and \( \Delta T \nonumber \) is temperature difference between 2 points of the sample (according to chosen length).
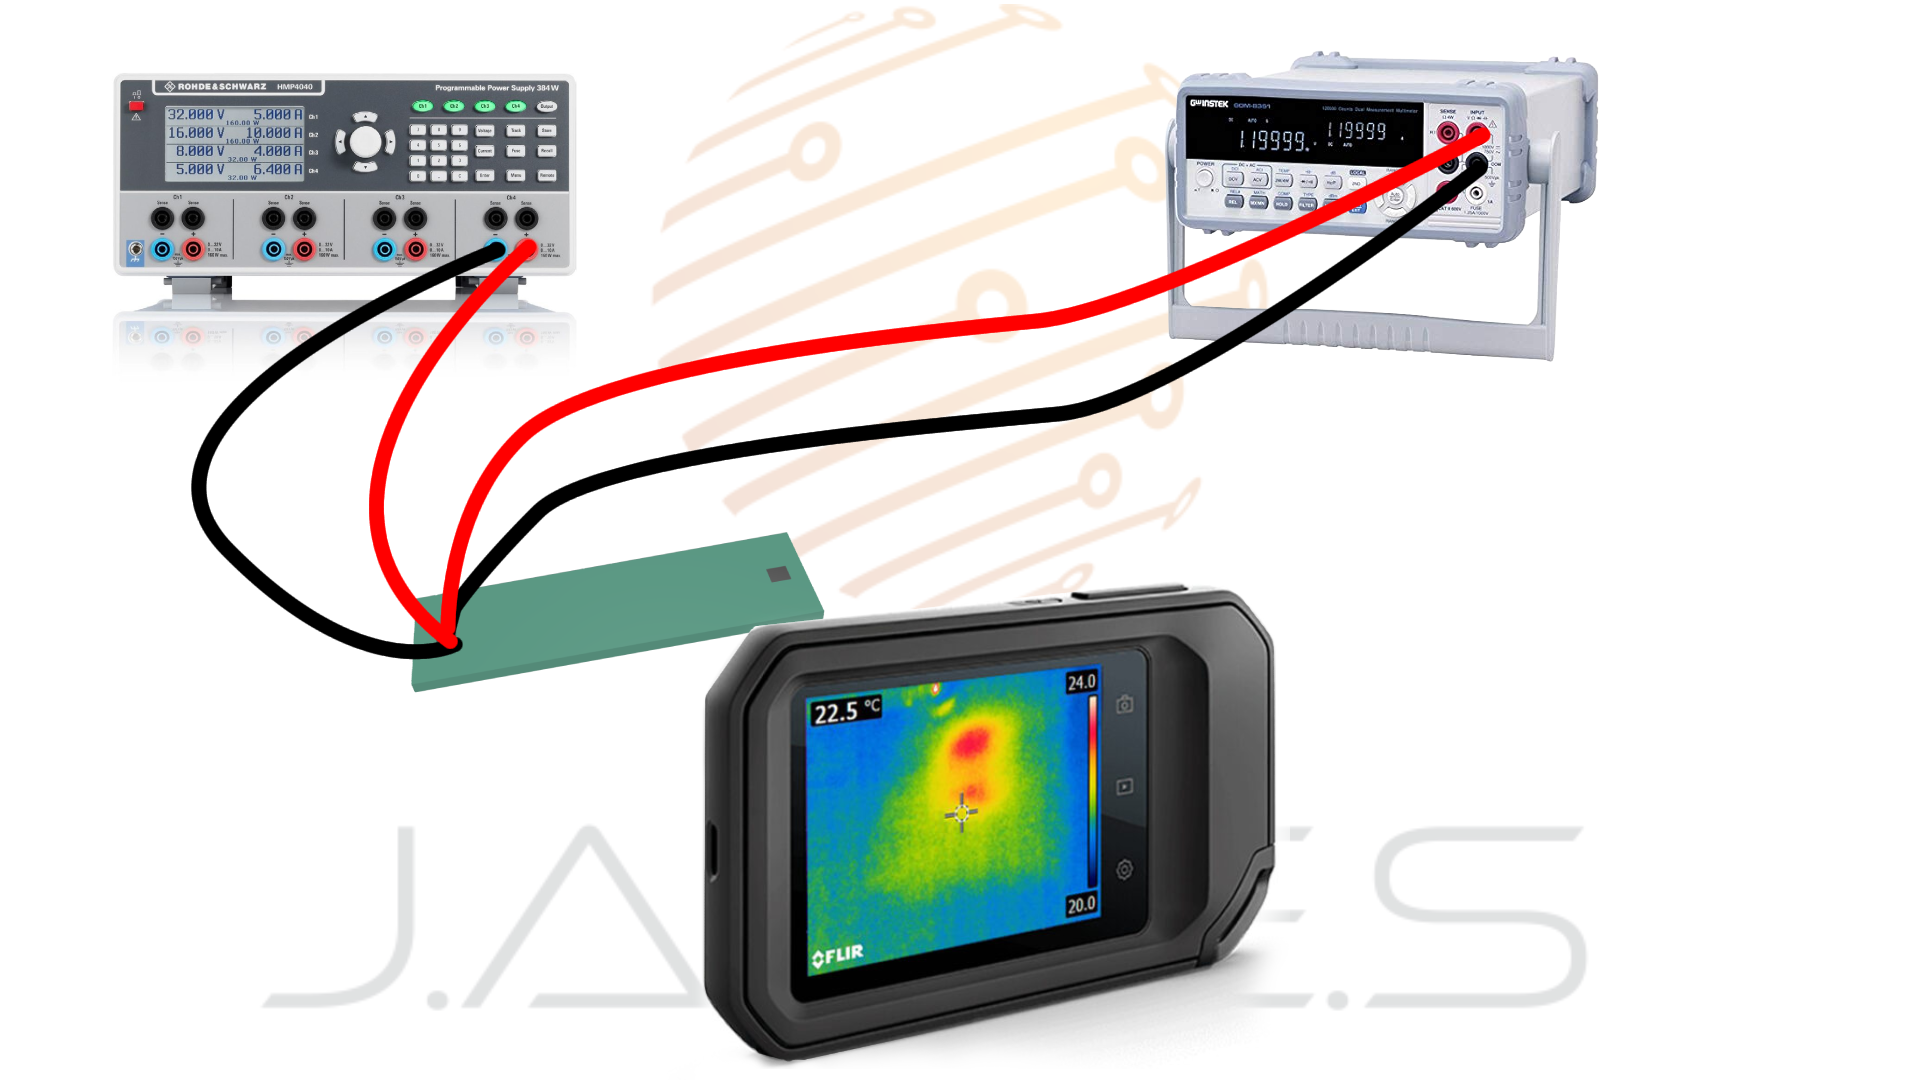 figure 4 - steady state setup diagram.
Tools and Instruments
Experimental Procedure
- Design of the sample with ease of use and ease of measurement access.
 figure 5 - designed sample for thermal conductivity coefficient measurements
- Export conductive and dielectric structures as object file.
- Export A and l Values from the design.
- Procure via online PCB provider. Using the main setup to measure the k value over steady state level.
- Building the setup described in figure 4 above.
- Logging the measurements of power and temperatures until it gets to the steady state (less than \( 0.1^oC \nonumber \) change).
- Calculate \( k \nonumber \) Value using next eqation \( k=\frac{P_{in}\cdot l}{A\cdot (T_1-T_2)} \) and collected data in a steady state setup. the equation number 3 adopted from eqation number 2.
- Creating a validation setup based on Wiedemann-Franz Law.
- The setup diagram is shown in Fig 5 below.
- Logging parameters:
- Voltage
- Currnet
- Steady temperature of the conductor
- Fill excel tables with the measured data, calculate electrical resistivity, conductivity and the thermal conductivity coefficient values as follows:
- Electrical resistivity: \( V=I\cdot R, R=\rho\cdot\frac{l}{A} \Rightarrow \rho=\frac{V\cdot A}{I\cdot l} \), in units of \( \frac{\Omega}{m} \nonumber \).
- Electrical conductivity: \( \sigma=\frac{1}{\rho}=\frac{I\cdot l}{V\cdot A} \), in units of \( \frac{S}{m} \nonumber \).
- Thermal conductivity: \( k=\frac{L\cdot T}{\rho}=\sigma\cdot L\cdot T @ L = 2.45\cdot10^{-8} \) were the units are \( [k]= 1\frac{W}{mK} \nonumber \) and \( [L] = \frac{v^2}{k^2} \nonumber \).
- Validation of values
- Verification of the methods using standard PCB with known values, with 10 units replication to create more reliable results.
- Comparing between \( k \nonumber \) value calculated using “Wiedemann-Franz Law” and steady state setup measurement. It would give us a variance between the 2 measurement setups.
- Compare the calculated thermal conductivity and calculated electrical conductivity to the material bulk state.
Results
At first it would be important to note that the bulk values of thermal conductivity and electrical conductivity of copper used in PCB are\( 355(\frac{W}{mK}), 5.96\cdot 10^7(\frac{S}{m}) \nonumber \) acordingly. the sample design same as for silver and can be seen in Fig 6.
The results of the steady state measurement:
The measured values:
\( P_{in} = 0.0004(W), T_1 = 34.8(^oC), T_2 = 33.9(^oC), l=0.08(m), A=0.2\cdot10^6(m) \nonumber \).
Using equation number 3 and the constants above to calculate the thermal conductivity coefficient:
\( k_{copper}=\frac{P_{in}\cdot l}{A\cdot (T_1-T_2)} =\frac{0.0004\cdot 0.08}{0.1\cdot10^{-6}\cdot (34.8-33.9)}=355.556 \).
The calculated thermal conductivity coefficient value is: 355.556, the units for \( k_{copper} \nonumber \) are \( \frac{W}{m^oK} \nonumber \) or \( \frac{W}{m^oC} \nonumber \) the difference in the temperature units occur due to relativeness of the temperature in the formula.
The results of the verification setup based on Wiedemann-Franz Law:
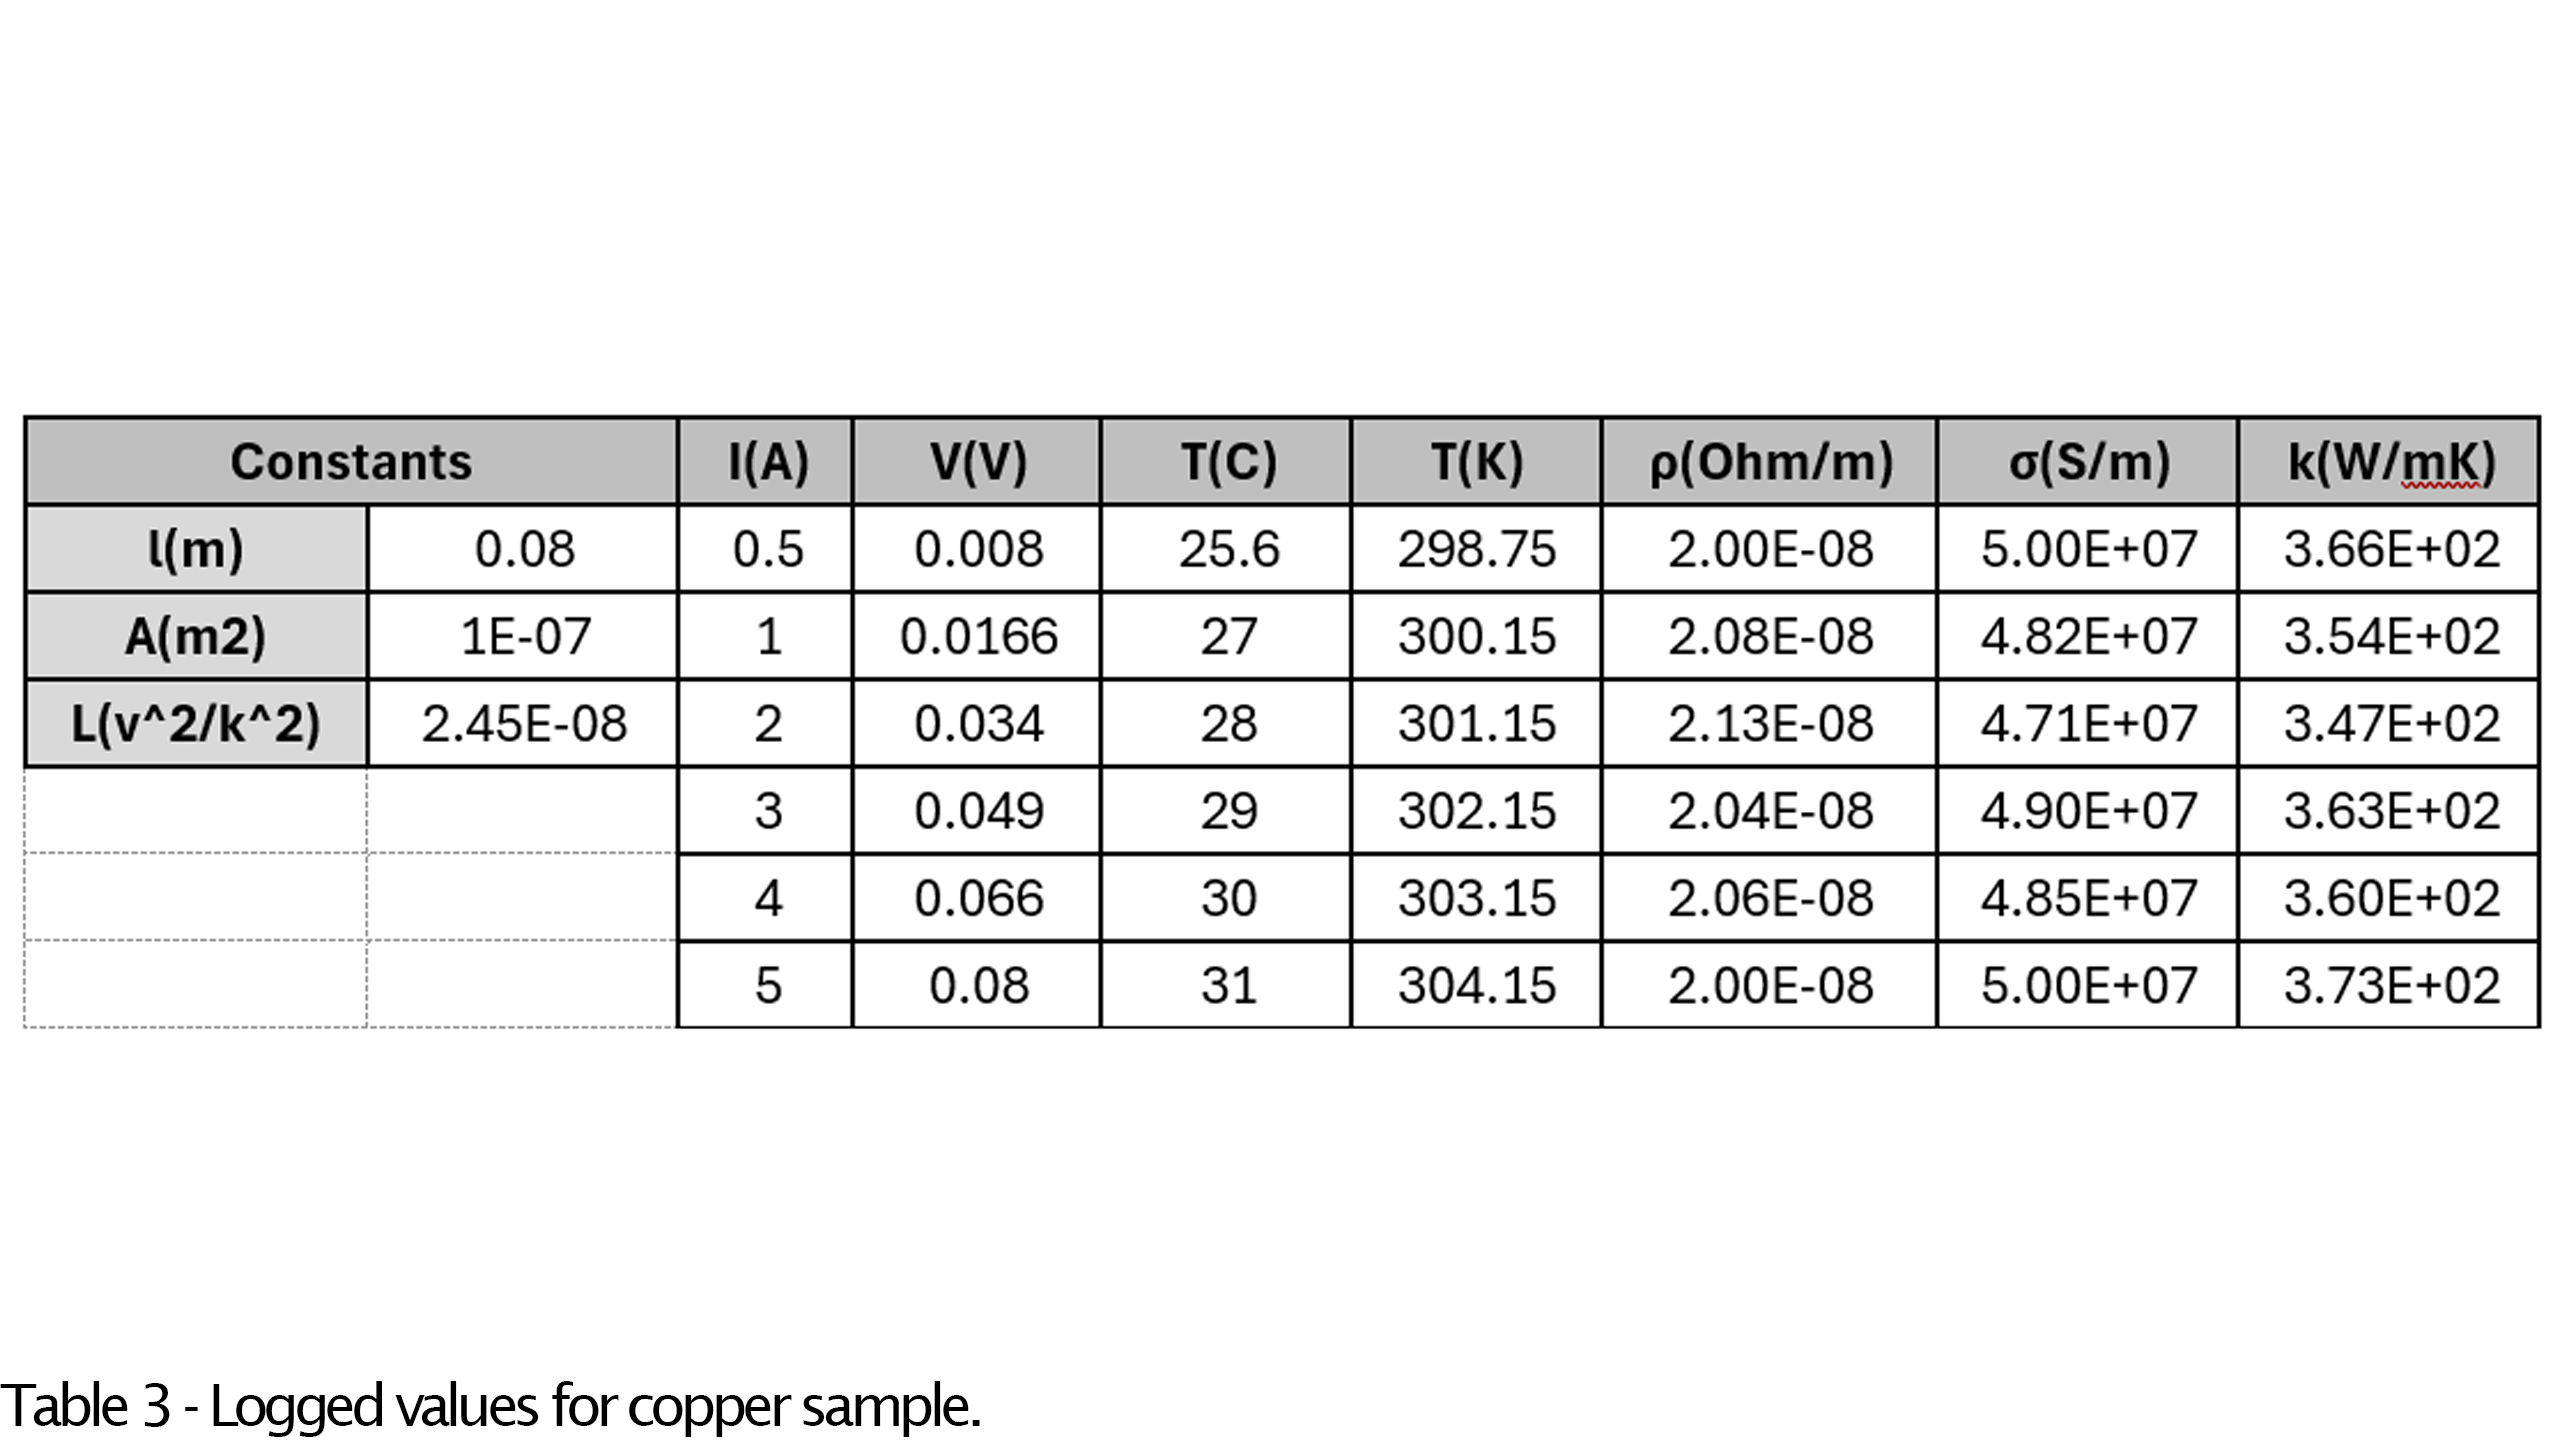
Based on Table 3 above with logged values from the setup, the calcultaed average thermal conductivity coefficient is \( 360.47(\frac{W}{mK}) \nonumber \) with 2.2% deviation, and the average electrical conductivity value is \( 4.88\cdot10^7(\frac{S}{m})\nonumber \) with deviation of 2.1%.
The difference between the main and verification setup in case of the thermal conductivity coefficient is at 1.38%.
Discussion
In this discussion the results will be analyzed and a conclusion provided in the next paragraphs.
- Steady state setup – This involves a heating pad on one side of the trace, measuring the trace temperature and the temperature difference between the heated pad and the pad on the other side of the trace.
- This setup requires high accuracy in temperature measurements. The used thermal camera was not accurate enough, so it necessitated obtaining an average value over time.
- Verification setup based on Wiedemann-Franz Law – We can refer to the conductive structures as metal; therefore, using the Wiedemann-Franz Law is justified.
- As seen in Table 3, the average electrical conductivity of copper is \( 4.88\cdot10^7(\frac{S}{m})\nonumber \), representing around 82% of the bulk copper conductivity, the same applies to the thermal conductivity, as shown in Table 3, is \( 360.47(\frac{W}{m^0C}) \nonumber \), which is approximately 89% of the bulk value.
- after testing deeply the Wiedemann-Franz Law it can be seen that the tolerance of the measurement is not acurate dispite the values seen in the results. in table 3 results the conductivity of copper is around 20% lower then the expected value.
this results cancells this setup from moving further.
- validation can be tested by comparing the measured copper thermal conductivity coefficient value and the known value of PCB copper. the calculation: \( tol(\%) =\frac{355.556(\frac{W}{m^oC})-355(\frac{W}{m^oC})}{355(\frac{W}{m^oC})} \cdot100\% = 0.15\% \)
- as can be seen from equation number (9), the tolerance is limited by 0.15%, however the camera measurements tollerance is \( 0.1^oC \nonumber \) it mean that our error in copper is limited by 10%, it can be measured using equation number 8, with addition of 0.2 tollerance to the \( \Delta T \nonumber \) number, like this: \( k_{copper}=\frac{P_{in}\cdot l}{A\cdot (-\Delta T+0.2)} =\frac{0.0004\cdot 0.08}{0.1\cdot10^{-6}\cdot (34.8-33.9+0.2)}=290.91 \frac{W}{m^oC} \) and it would bring us to tollerance at around 18%. this is the maximal tollerance possible to get with the curent setup due to thermal measuring device.
- reducing the tolerance would be required by using more acurate thermal sensors.
- This setup may be used to get raw initial data about the thermal performance of AME conductive inks.
- This setup required only a few wires and some samples to get ordered, due to that the only costs applied to us in this setup were for the samples and few wires.
- The setup assumed that this setup would be created in a basic electrical lab with power supply, multimeter and soldering equipment.
- The tolerance achieved whithin this setup is 0.15% and this value whitstand the goal of this measurement article.
- theoretical error may go up to 18%, this error extrimly heigh, and the error exist due to resolution of the thermal camera that was used to measure the temperature of the 2 points.
- the temparutere measurements may be done by sensors with heigher resolution with lower tolerance, it would reduce measurements error and increase the acuracy of the measurements.
- The Wiedemann-Franz Law is temperature dependent and inaccurate for measurements. Based on that it should not be used as a part of this study, the acuracy we achieved in thermal conductivity coefficient value is coincidents only.
Future Work
The setup developed during this study plays a crucial role in evaluating thermal performance of the conductive inks used in AME processes. Although the setups may be optimized by enhancing the accuracy of temperature measurements, they should remain as cost-effective as possible while maintaining a tolerance of 10% however another way of temperature sensing required to reduce the potential measurement error.
The next steps would involve creating a stable structure for the setup that operates without the need for soldering, thus increasing its ease of use. The setup should require no adaptations or calibrations except for the use of substrates with tested conductive ink. This approach would enable quick analysis of the inks' thermal performance. Additionally, it would be beneficial to establish a cost framework for the setup construction along with a detailed bill of materials.
Conclusion
The main purpose of this article was to develop a fast and economical method to get the viability of using AME conductive materials under specific thermal conditions, potentially for heat dissipation purposes in different applications. It can be concluded that the goal has been successfully achieved. While the method requires further optimization and increased stability, it manages to achieve results within a 10% tolerance level, which is acceptable for the purposes of this study.
This method should serve as an initial verification method to identify suitable materials for use in specific applications. The cost-effectiveness of the project was enhanced by utilizing existing equipment, which not only reduced expenses but also kept the overall costs around 100€. This method demonstrates a viable pathway for preliminary material selection in the field of AME.
References
- ROHM Co., Ltd. (2021). Basics of thermal resistance and heat dissipation. https://fscdn.rohm.com/en/products/databook/applinote/common/basics_of_thermal_resistance_and_heat_dissipation_an-e.pdf
Related Articles


