Current Carrying Capacity Setup
In this article, we're diving into Current Carrying Capacity (CCC) measurements, basically, how much current can pass through a specific conductor area without exceeding its temperature rating. This article is an additional article within a series of articles that aim to create accessible setups for raw measurements of electrical parameters in new materials within Additively Manufactured Electronics (AME) sector. As before, we are not aiming for lab-grade precision or the most sophisticated measurement methods, we are focusing on cheap and straightforward techniques that any technical team can use to investigate the relevance of different materials for applications. The material portfolio in AME industry is growing fast and new materials with new manufacturing processes rapidly appear in the market, this led us to develop methods that will help you quickly figure out if a particular material or process is a good fit for your application. So, if you're experimenting with materials in AME and looking for practical, easy-to-apply test methods, this article-series will get you covered.
Due to the ongoing process of improving these setups and increasing the availability of AME technology to the industry, we appreciate any suggestions, criticisms, or comments in the comments section at the end of the article.
Theory Basis
Current carrying capacity, often referred to as ampacity, is a critical parameter in electrical engineering that defines the maximum current an electrical conductor or device can carry without exceeding its temperature rating. This concept is vital for ensuring the safe and efficient operation of electrical systems, preventing overheating, and avoiding potential failures or hazards. Ampacity depends on the following factors:
Conductor Material
- Conductivity - Materials with high electrical conductivity, such as copper and aluminum, have higher current carrying capacities. Copper is commonly preferred due to its superior conductivity and thermal properties.
- Thermal Coefficient - The resistance of conductors changes with temperature. Materials with lower thermal coefficients are preferable as they offer more stable performance under varying thermal conditions.
Cross-Sectional Area
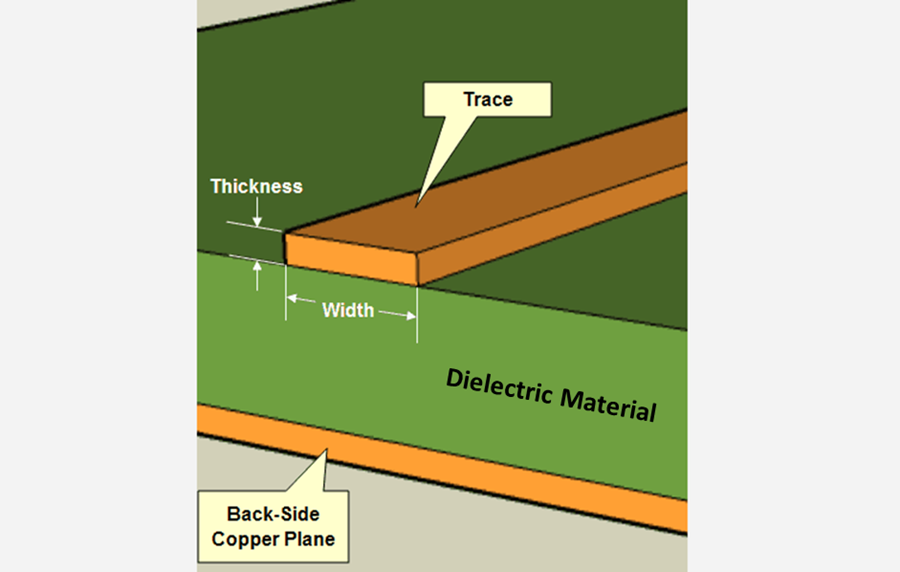
The ampacity of a conductor is directly proportional to its cross-sectional area. Larger cross-sectional areas can carry more current because they have lower resistance, reducing the heat generated by the current flow.
Insulation Type and Temperature Rating
The type of insulation used on a conductor affects its heat dissipation characteristics. Insulation materials have specific temperature ratings that determine the maximum permissible operating temperature of the conductor.
The higher the temperature rating of the insulation, the greater the current carrying capacity of the conductor.
Ambient Temperature
The surrounding temperature impacts the ability of a conductor to dissipate heat. Higher ambient temperatures reduce the current carrying capacity because the conductor starts at a higher initial temperature, leaving less margin for additional heating due to current flow.
Installation Conditions
Conductor Placement: Conductors installed in open air can dissipate heat more effectively than those in enclosed spaces or conduits. Bundling of cables also affects heat dissipation.
Ventilation: Adequate ventilation can enhance heat dissipation, increasing the current carrying capacity.
Frequency of the Current
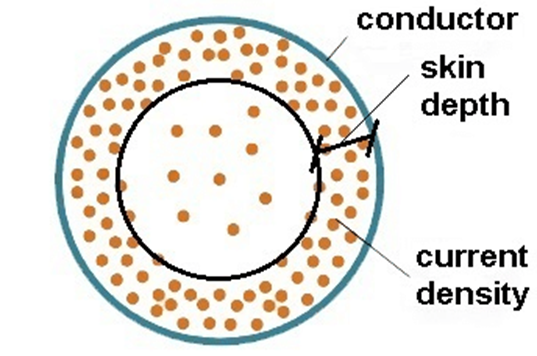
For alternating current (AC) systems, the frequency can influence the ampacity due to the skin effect, where current tends to flow on the surface of the conductor at higher frequencies, effectively reducing the conductor's cross-sectional area.
Calculation of Current Carrying Capacity
The current carrying capacity is typically calculated using standardized formulas provided by electrical codes and standards, such as the National Electrical Code (NEC) in the United States or the International Electrotechnical Commission (IEC) standards globally.
A basic formula for calculating ampacity is:
\( I_{max}=\sqrt{\frac{\Delta T}{R_{total}}}\nonumber \)
Where:
\( I_{max}\nonumber \)is the maximum current carrying capacity.
\( \Delta T\nonumber \)is the permissible temperature rise.
\( R_{total}\nonumber \)is the total thermal resistance from the conductor to the ambient environment.
More comprehensive calculations consider additional factors, including insulation type, ambient temperature, and installation conditions, often using derating factors provided in tables within the standards.
Additional calculation provided by IPC-2221 standard, this standard is generic PCB qualification and acceptance criteria. This standard refers to generic design. However there is more specific standards applying to different types of production technologies/boards, these specific standards can be found throughout the 2220 series of standards.
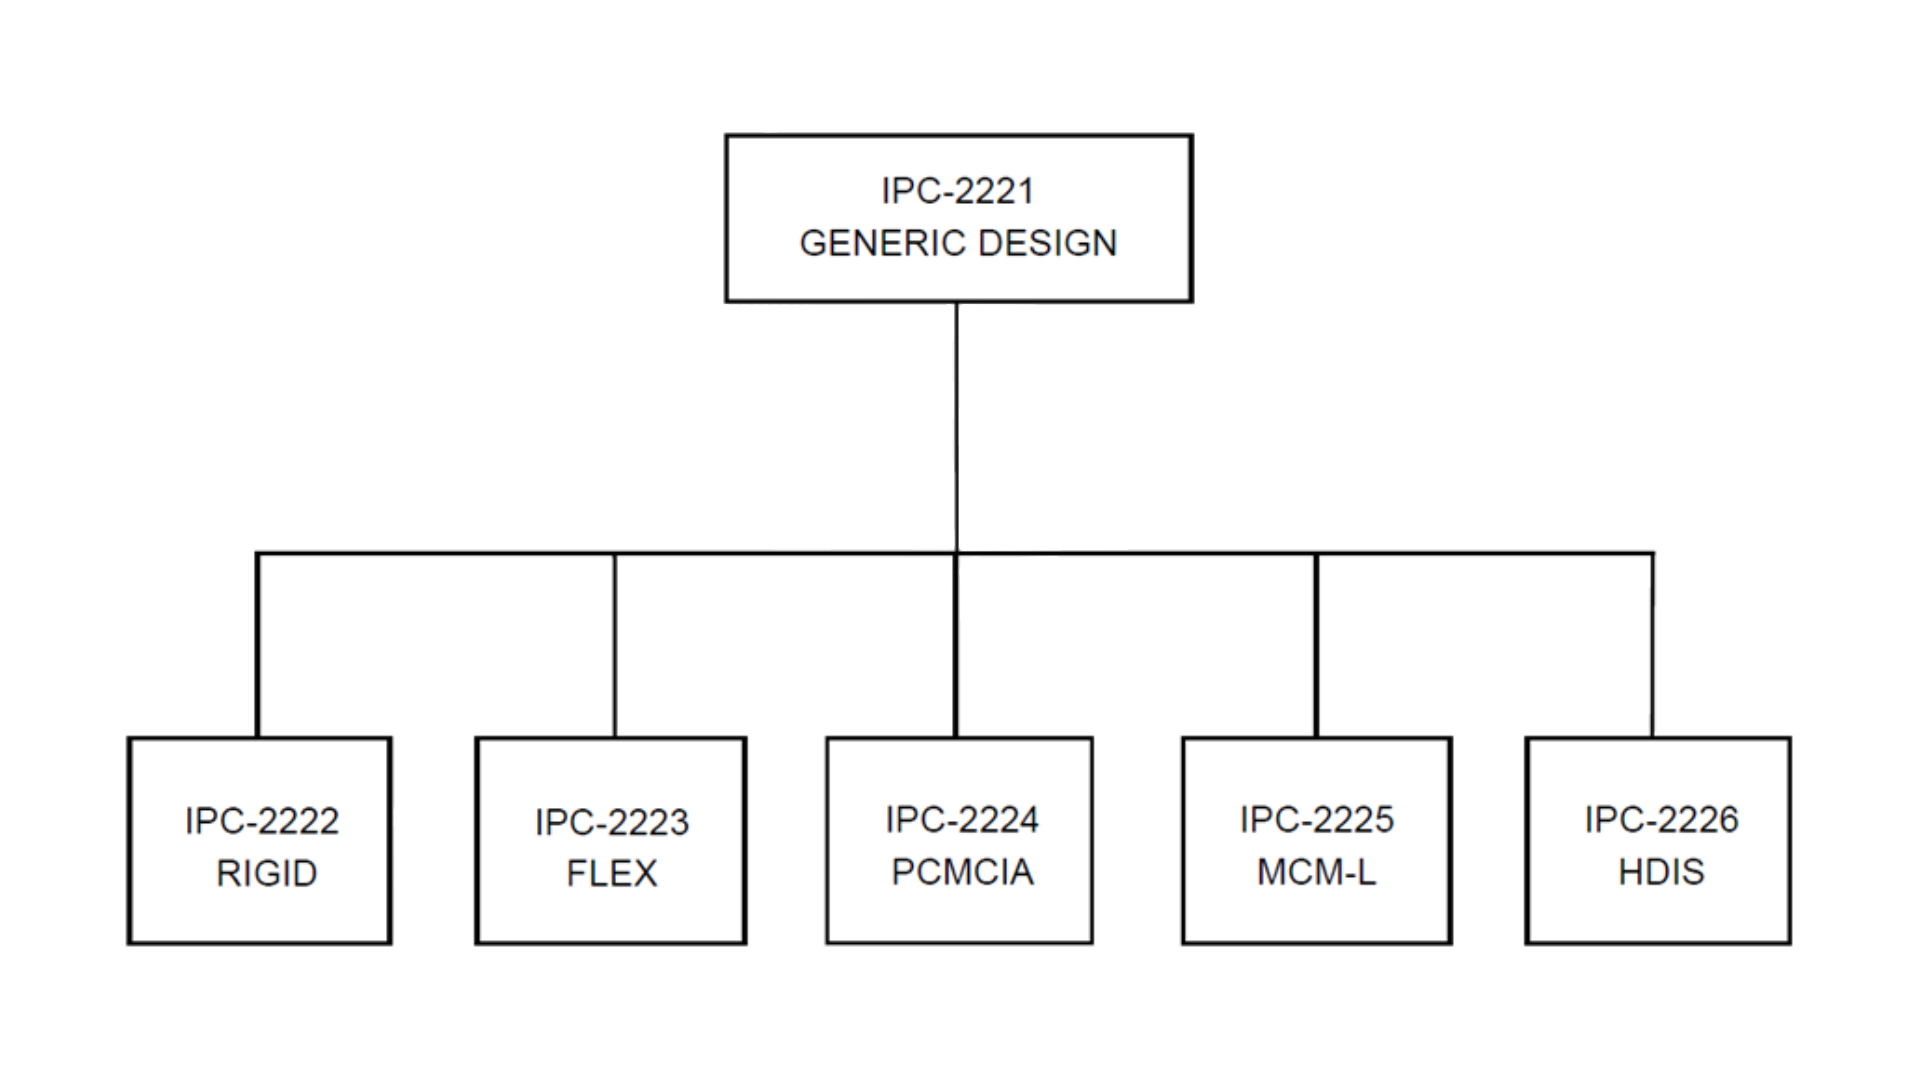 Figure 4 - IPC standard for Current Carrying Capacity
The IPC-2221 splits into 2 main sections, “section 6.2 – conductive material requirements” and “Appendix B”. These two sections contain graphs relating to correlations between the trace width, max current carried by the same trace, and temperature difference that would be achieved in this trace. This standard provides a single formula in “section 6.2” that relates to the previously mentioned parameters:
\( I=k\cdot\left(\Delta T\right)^{0.44}\cdot A^{0.725} \nonumber \)
\( k = \begin{cases} 0.048 & \text{(external layers)} \\ 0.024 & \text{(internal layers)} \end{cases} \nonumber \)
Using this formula, you can determine the cross-sectional area, then you can check which width is working better for the specific temperature rise you want for a design.
Importance of Implications
The understanding and accurate determination of the current carrying capacity is crucial for several reasons:
- Safety: Preventing overheating and potential fire hazards.
- Efficiency: Ensuring optimal performance and longevity of electrical systems.
- Regulatory Compliance: Adhering to national and international electrical codes and standards.
Methodology
Main measurement setup:
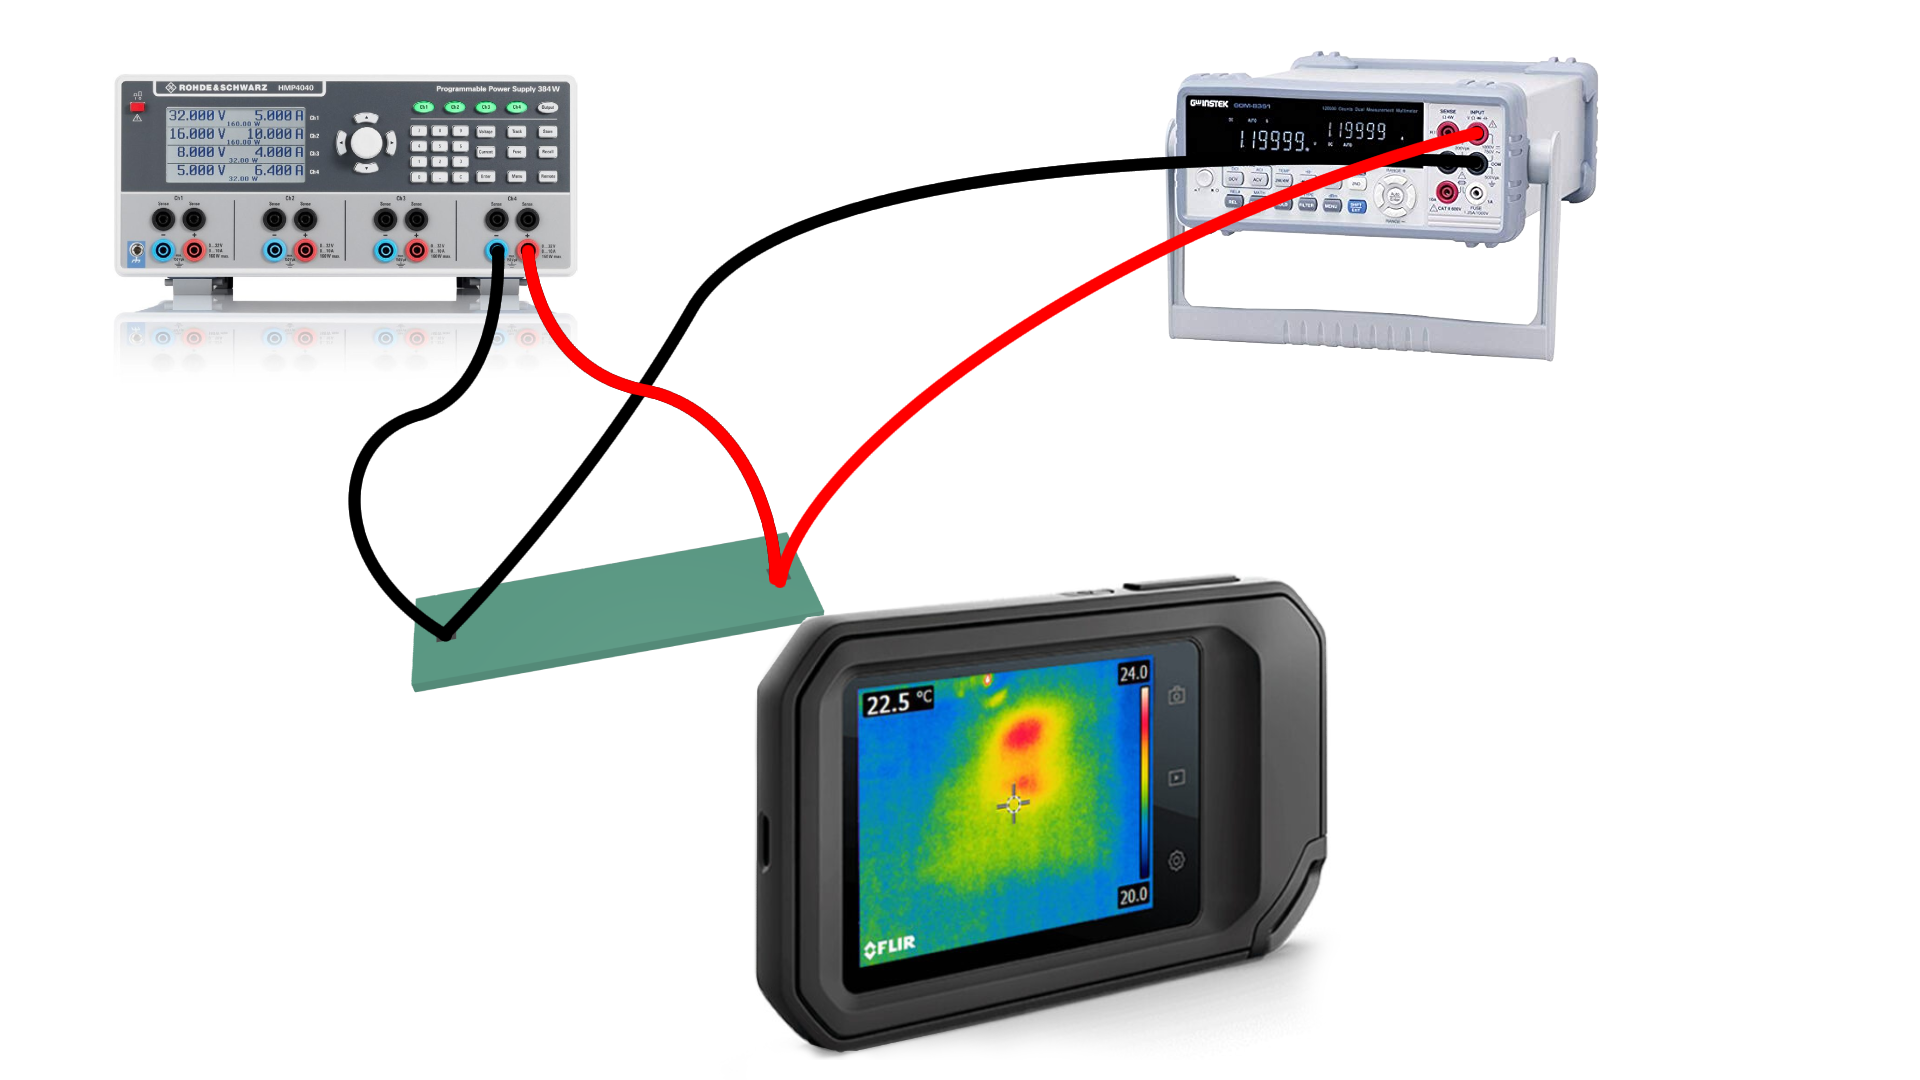
Based on the theory, we have four main variables. Although we are not trying to determine the required cross-sectional area for a design, our primary objective is to understand the thermal response under a continuously applied constant current on a trace with a fixed cross-sectional area, ambient temperature, and dielectric material. This means all parameters are fixed, except for the trace temperature and the current applied to the trace. The setup for these measurements is as follows:
This setup enables us to measure the current and voltage across the trace and to measure the temperature through radiation emitted from the trace.
Tools and Instruments:
Measurements
Experimental procedure:
- Preparing the samples –
- Use samples from the thermal conductivity coefficient measurement setup.
- Solder wires onto each pad.
- Mark identification numbers on each sample.
- Build the Setup Environment:
- Follow the description in the methodology section.
- Measurements:
- Connect the power supply to the board and set it to a 1A limit.
- Connect the RLC meter to the board connections.
- Turn on the IR camera and adjust settings such as distance from the object.
- Wait 25 minutes for the temperature to stabilize.
- Record the current, voltage, and temperature.
- Repeat the measurements:
- Increase the current in steps of 1A, recording measurements until reaching 10A or 100°C.
- Repeat for Each Sample.
- Perform steps 3 and 4 for all 14 PCB samples.
- Build Graphs for Analysis.
- Plot the temperature dependence on the amount of current flow, presenting the average values.
- Plot the resistance of the trace dependence on the current value.
Results:
Figure 6 below shows the average temperature dependence on continuous current values:
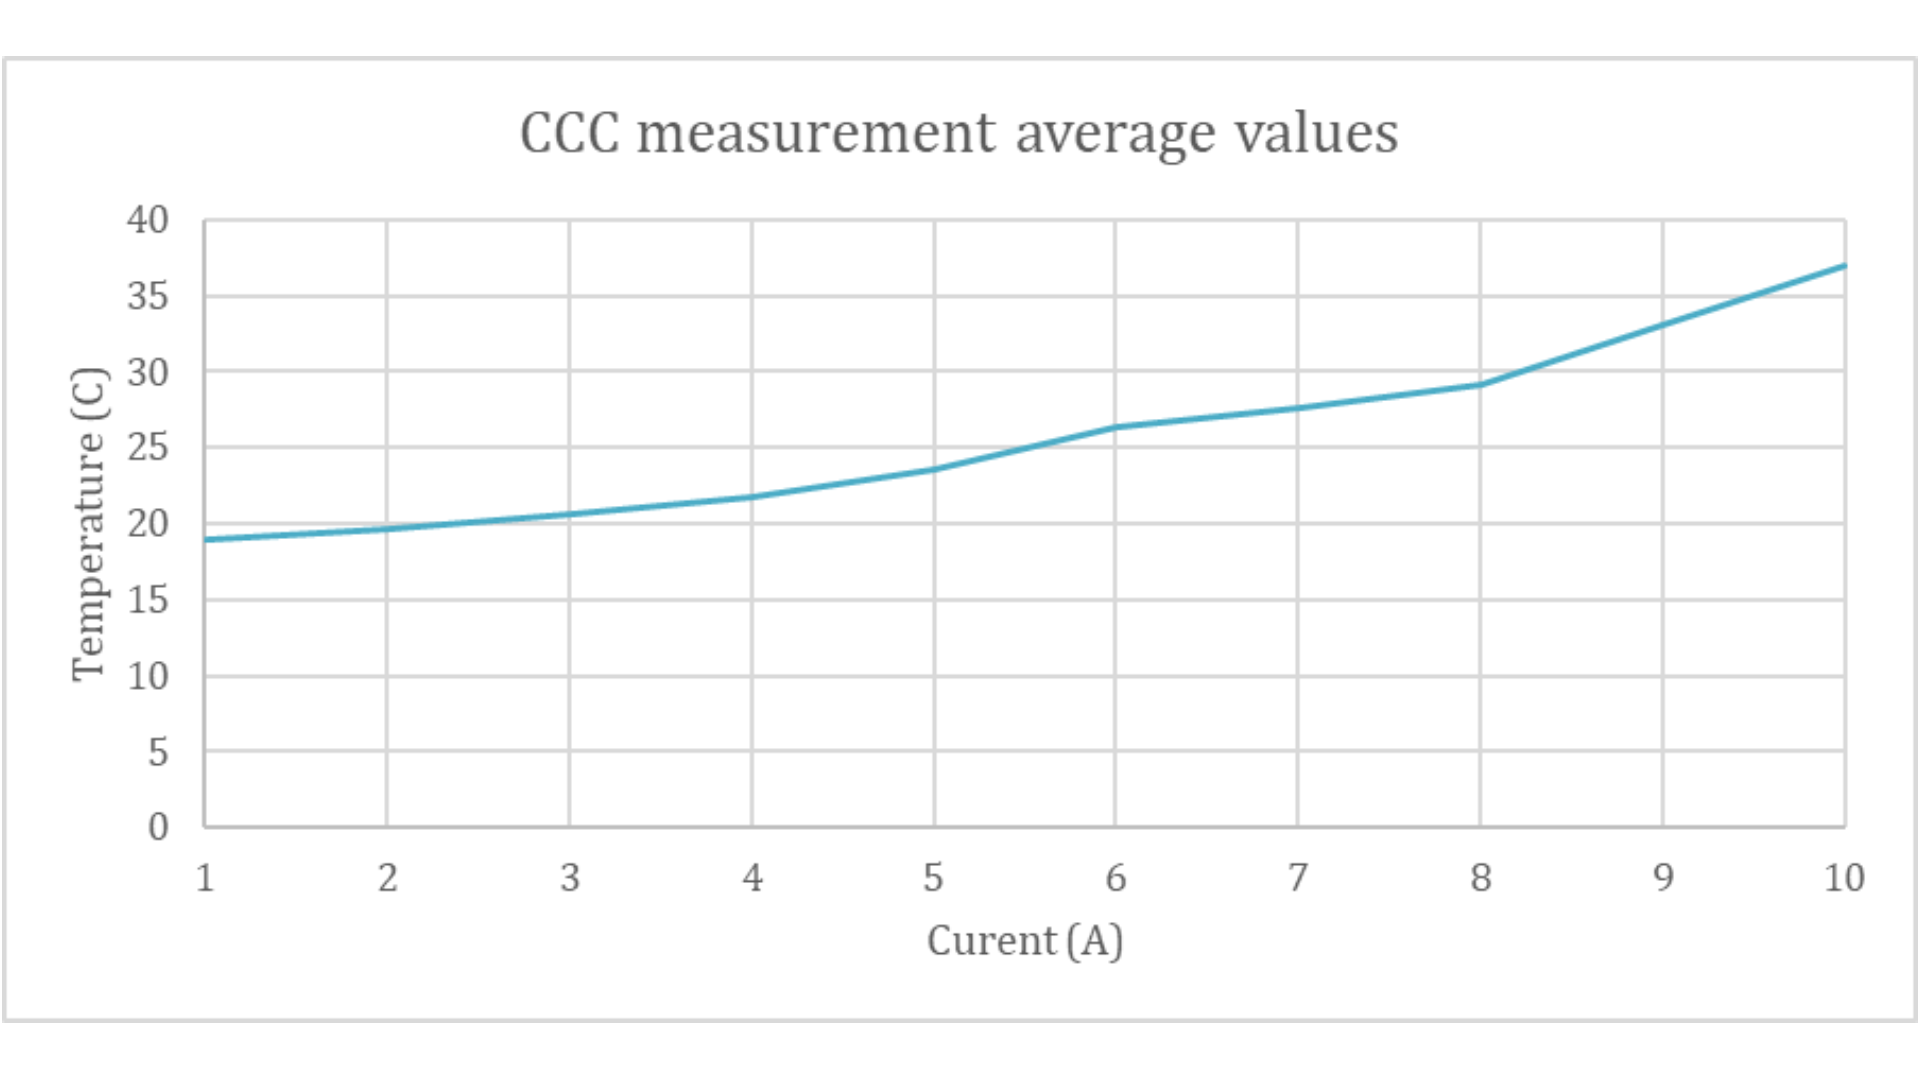 Figure 6 - Plotted average values of sample temperature dependent on current applied
Figure 7 presents the average resistance of the trace based on the measured voltage and applied current.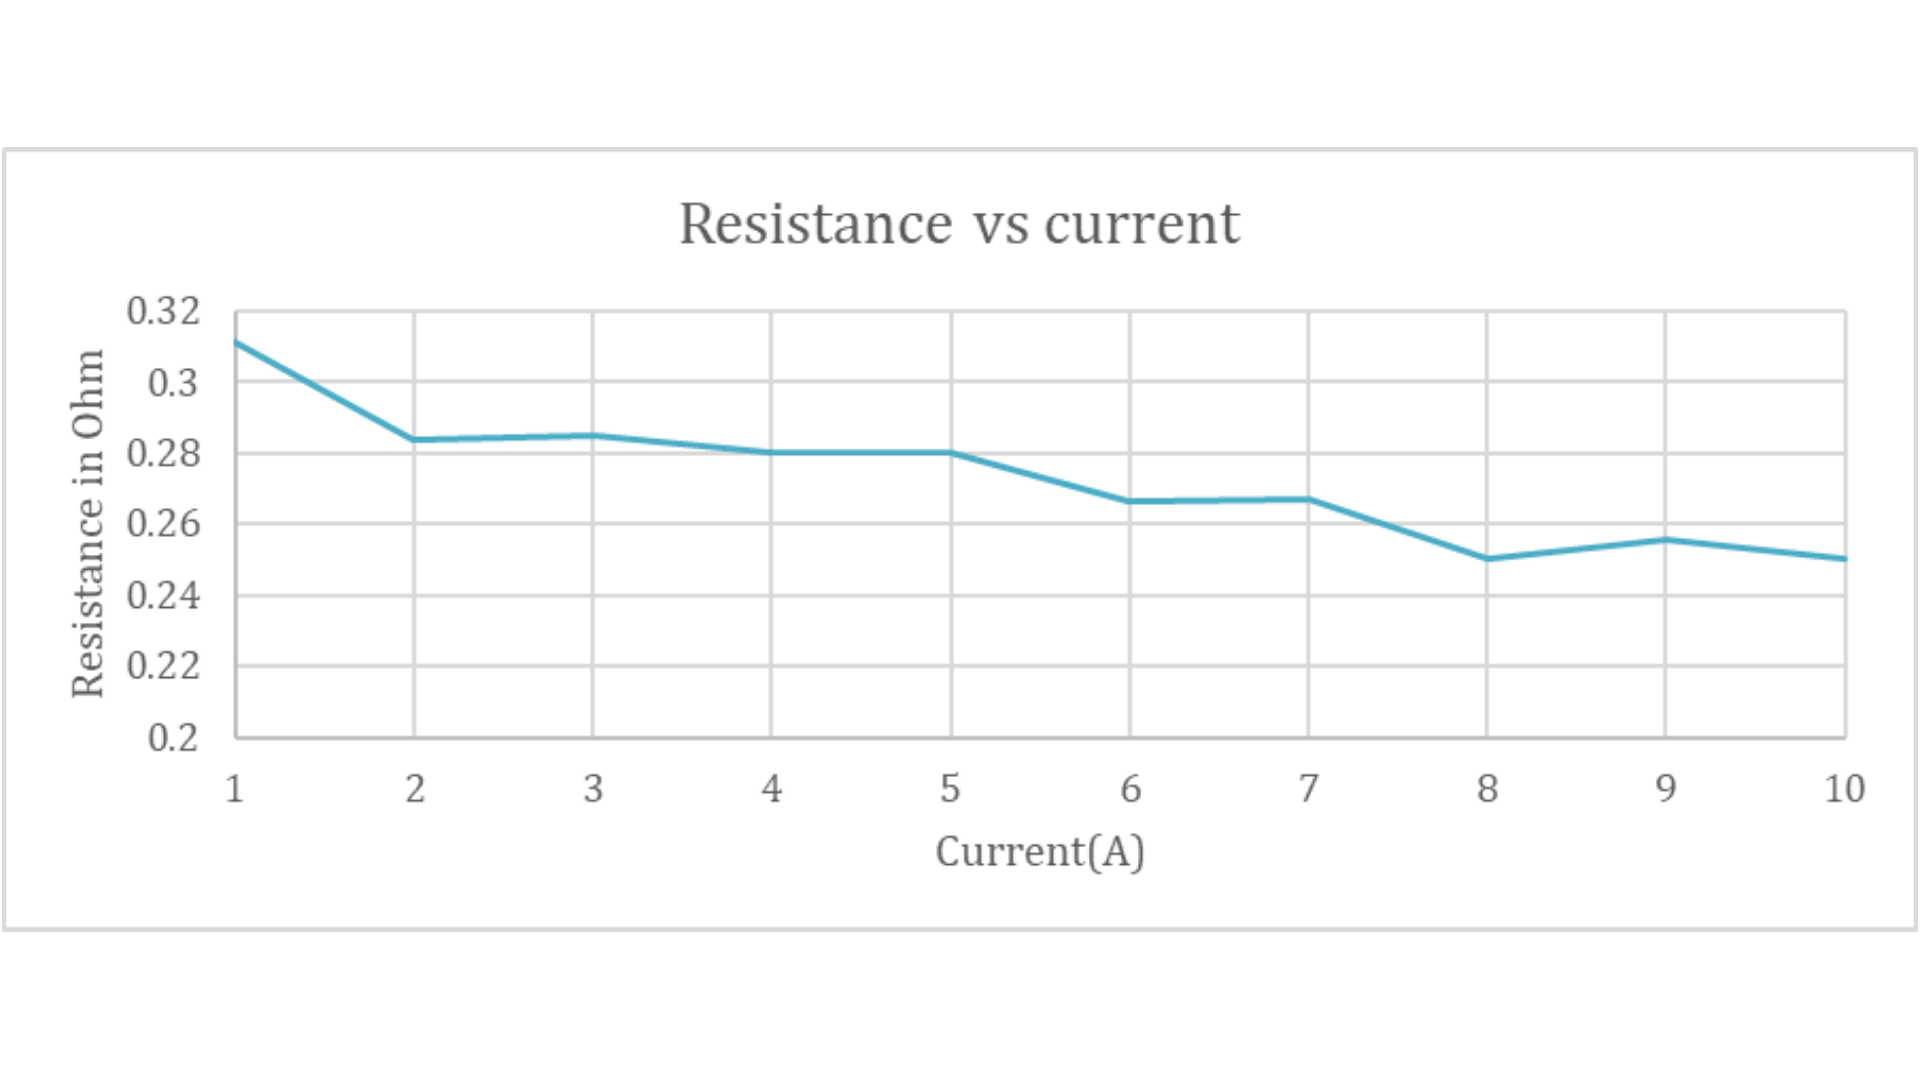 Figure 7 - Plotted average resistance of the trace.
Discussion
To understand the accuracy of the results, we must compare the achieved results to the known values. The reference graph from web resources appears as follows:
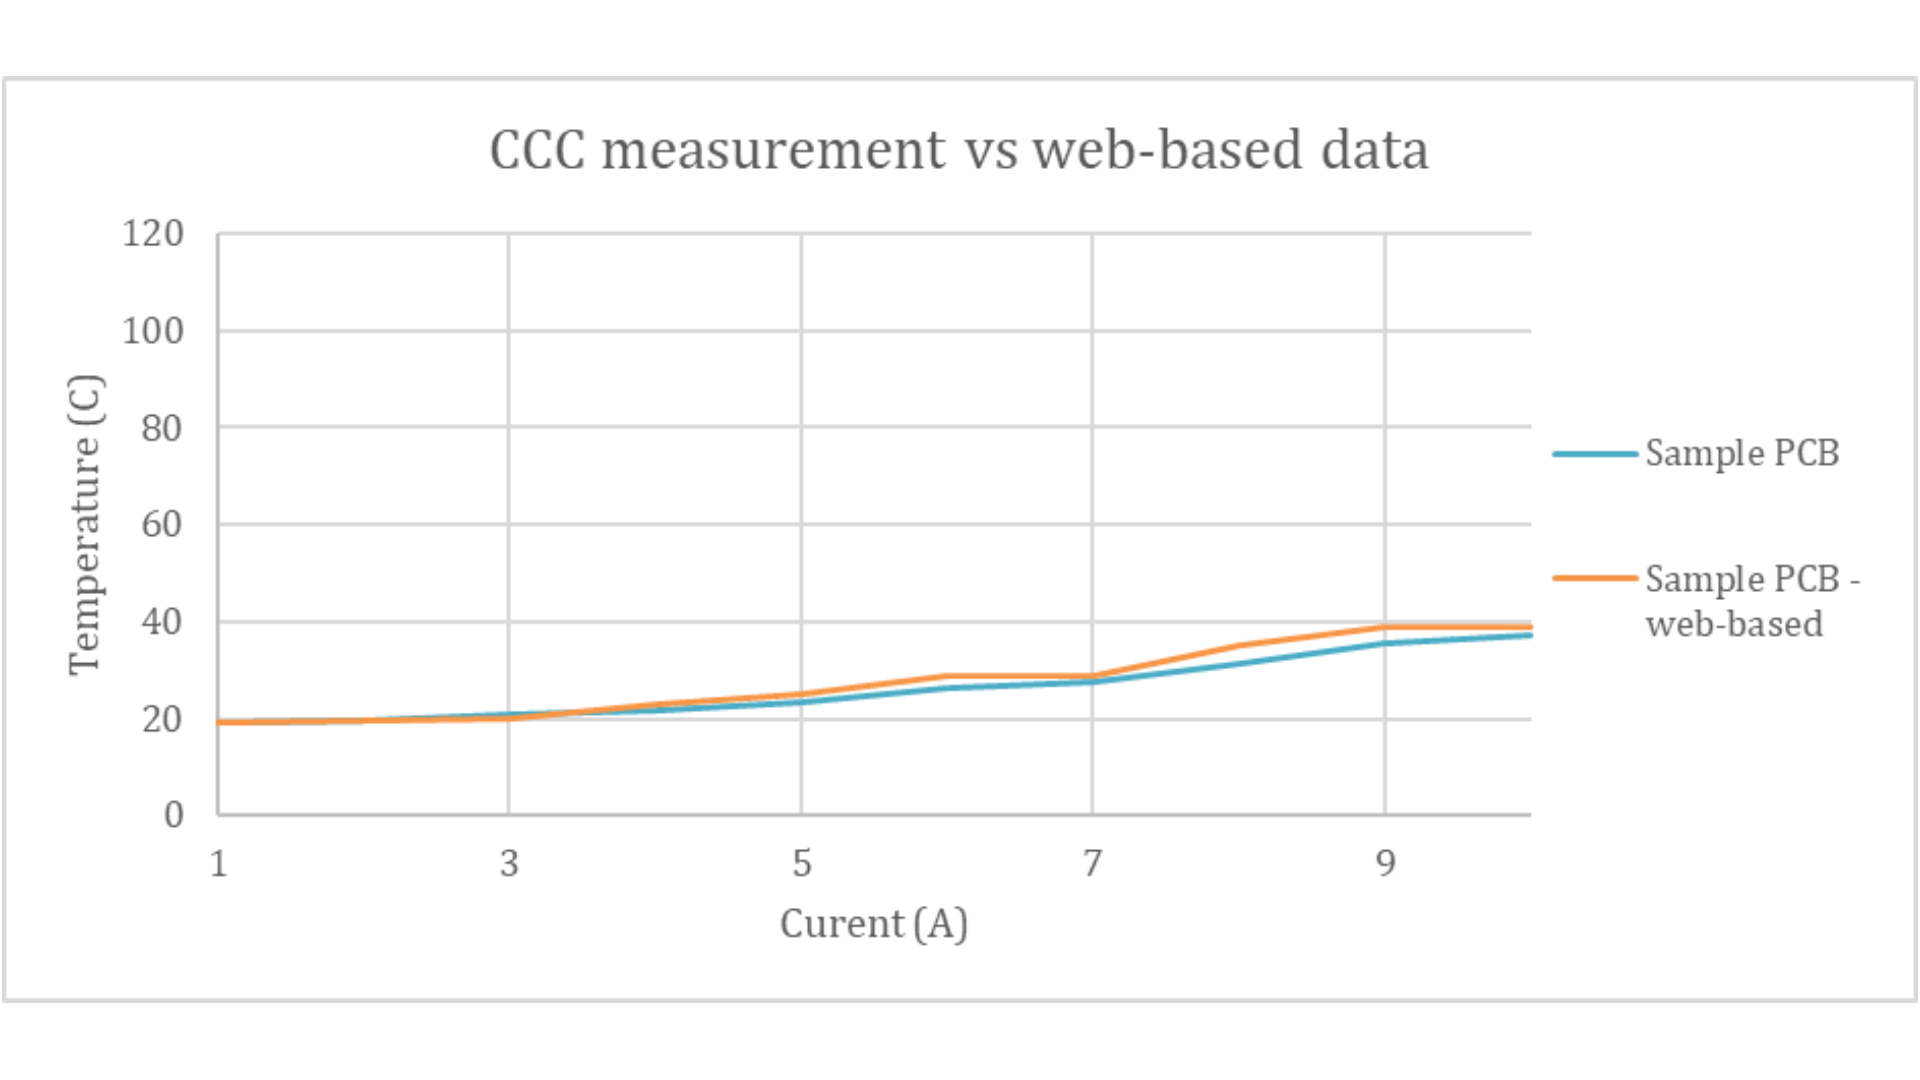 Figure 8 - Measured data and web-based reference.
As can be seen, the values are close. To be more precise, let's calculate the tolerance:
\( Tolerance=\frac{35-31.3}{35}\cdot100\%=10.5\% \)
We can see in Equation 1 that this setup provides us with a 10.5% tolerance in comparison to known data from the web.
While the calculation and data differ slightly from the IPC and IEC standards, this method simplifies repetition and application to new inks that can be used to create AME.
If we provide a more accurate temperature measuring setup, we could further enhance the reliability of this setup.
Future work
- Design a Setup with Increased Accuracy in Temperature Measurement:
- Develop a more precise temperature measurement system to improve the reliability of the data.
- Automate the Setup:
- Create a more automated setup that allows for easy board changes without the need for soldering, enabling plug-and-play tests.
- Repeat the Test with Known Ink:
- Conduct tests using known inks and compare the results to provided datasheets.
- Perform comparisons with different customers to achieve mass validation of the results.
Conclusion:
The current carrying capacity of electrical conductors and devices is a fundamental concept in electrical engineering, governed by material properties, physical dimensions, environmental conditions, and installation practices. Accurate determination of ampacity ensures the safe, efficient, and reliable operation of electrical systems, emphasizing the importance of a thorough understanding and application of the relevant standards and guidelines. This makes it crucial to obtain accurate ampacity information before starting the design phase of any application.
References
- Llc, K. a.-. E. (n.d.). Heavy Copper and EXTREME Copper in PCB design for maximum reliability. https://www.epectec.com/articles/heavy-copper-pcb-design.html
- Team, S. (2023, May 25). Role of PCB Trace current capacity in design. Sierra Circuits. https://www.protoexpress.com/blog/trace-current-capacity-pcb-design/
- Topolski, Łukasz & Warecki, Jurij & Hanzelka, Zbigniew. (2019). Methods for determining power losses in cable lines with non-linear load.
- Peterson, Z. (2024, May 19). IPC-2221 Calculator for PCB Trace Current and Heating. Altium. https://resources.altium.com/p/ipc-2221-calculator-pcb-trace-current-and-heating


